
Johnson Carried 81% of City’s Wards
Sweeping victory in low-turnout election, lowest in an open race for Milwaukee mayor since 1900.
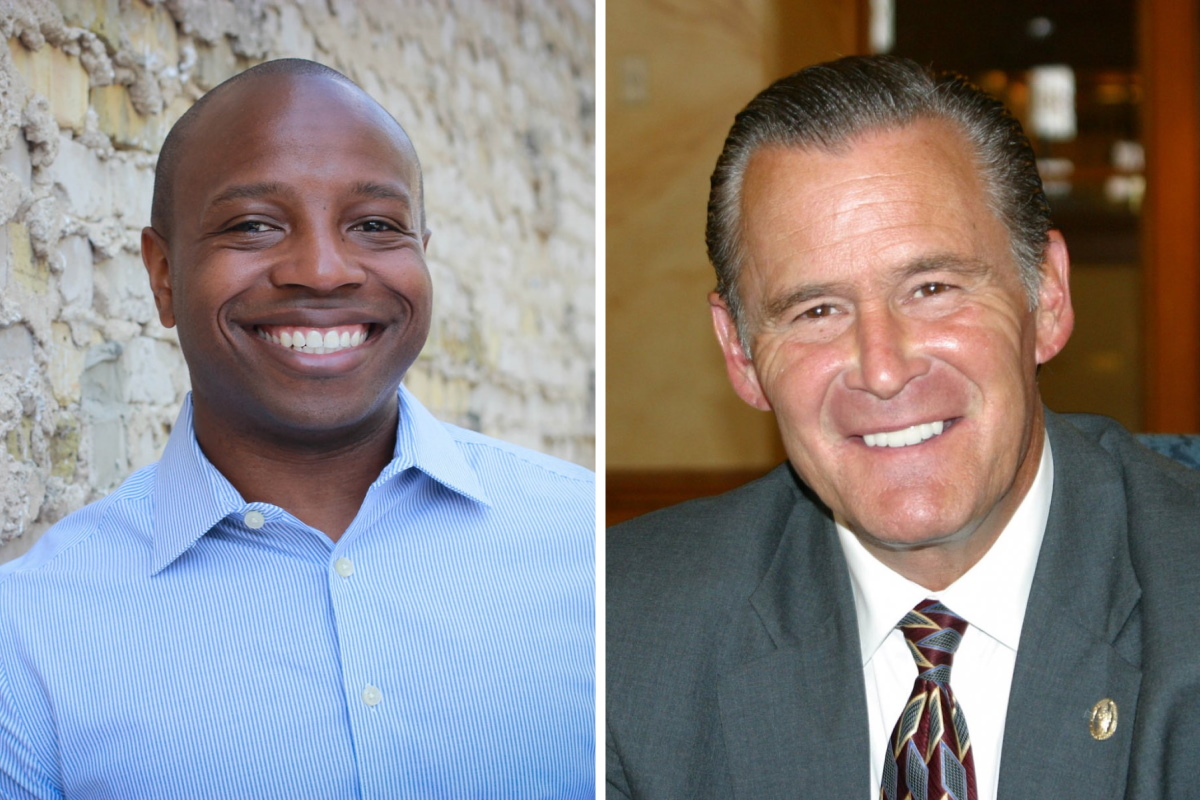
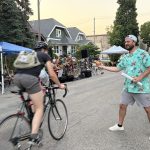
Cavalier Johnson and Robert Donovan. Photos from their campaigns.
Cavalier Johnson won the Milwaukee mayoral election with the largest vote share since Tom Barrett’s first reelection in 2008. According to unofficial returns, Johnson won 72% of the vote to Bob Donovan’s 28%. This exceeds Barrett’s performance in 2020, 2016 and 2012.
Of Milwaukee’s 315 populated wards, Johnson carried 256 — or more than 81% — and Donovan just 58, or less than 19%. The two candidates tied in the 311th ward (near Alverno College), where each candidate received exactly 151 votes.
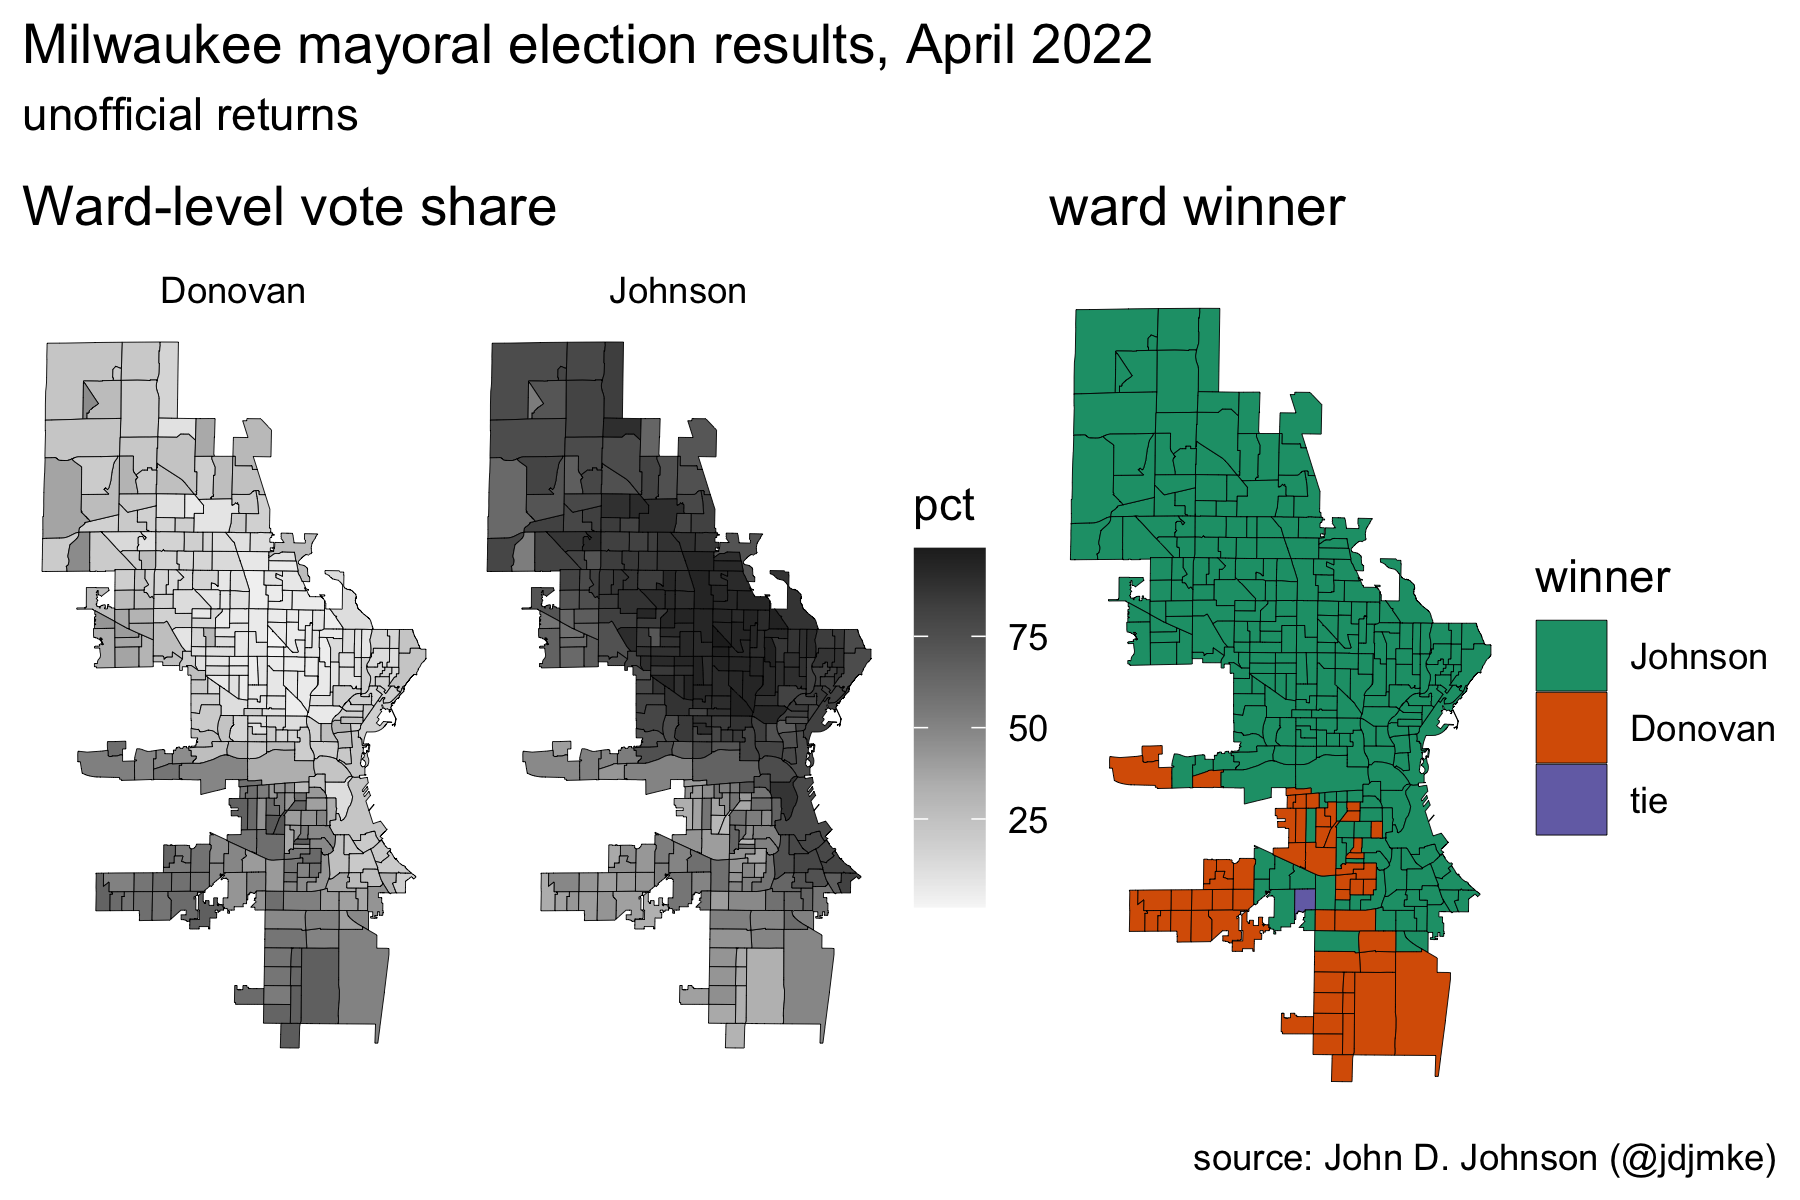
Milwaukee mayoral election results, April 2022 (unofficial returns)
In the end, Donovan’s ceiling of support appears to have been very close to his floor. With seven candidates running in the primary, he received 22% of the vote. His general election performance only improved by six points to 28%.
In the general election Donovan improved his performance relative to Johnson in only 13 of 315 wards. In every other ward, the balance of power shifted toward Johnson. The map below shows the change in vote margin between the two candidates in each ward from the primary election to the general.
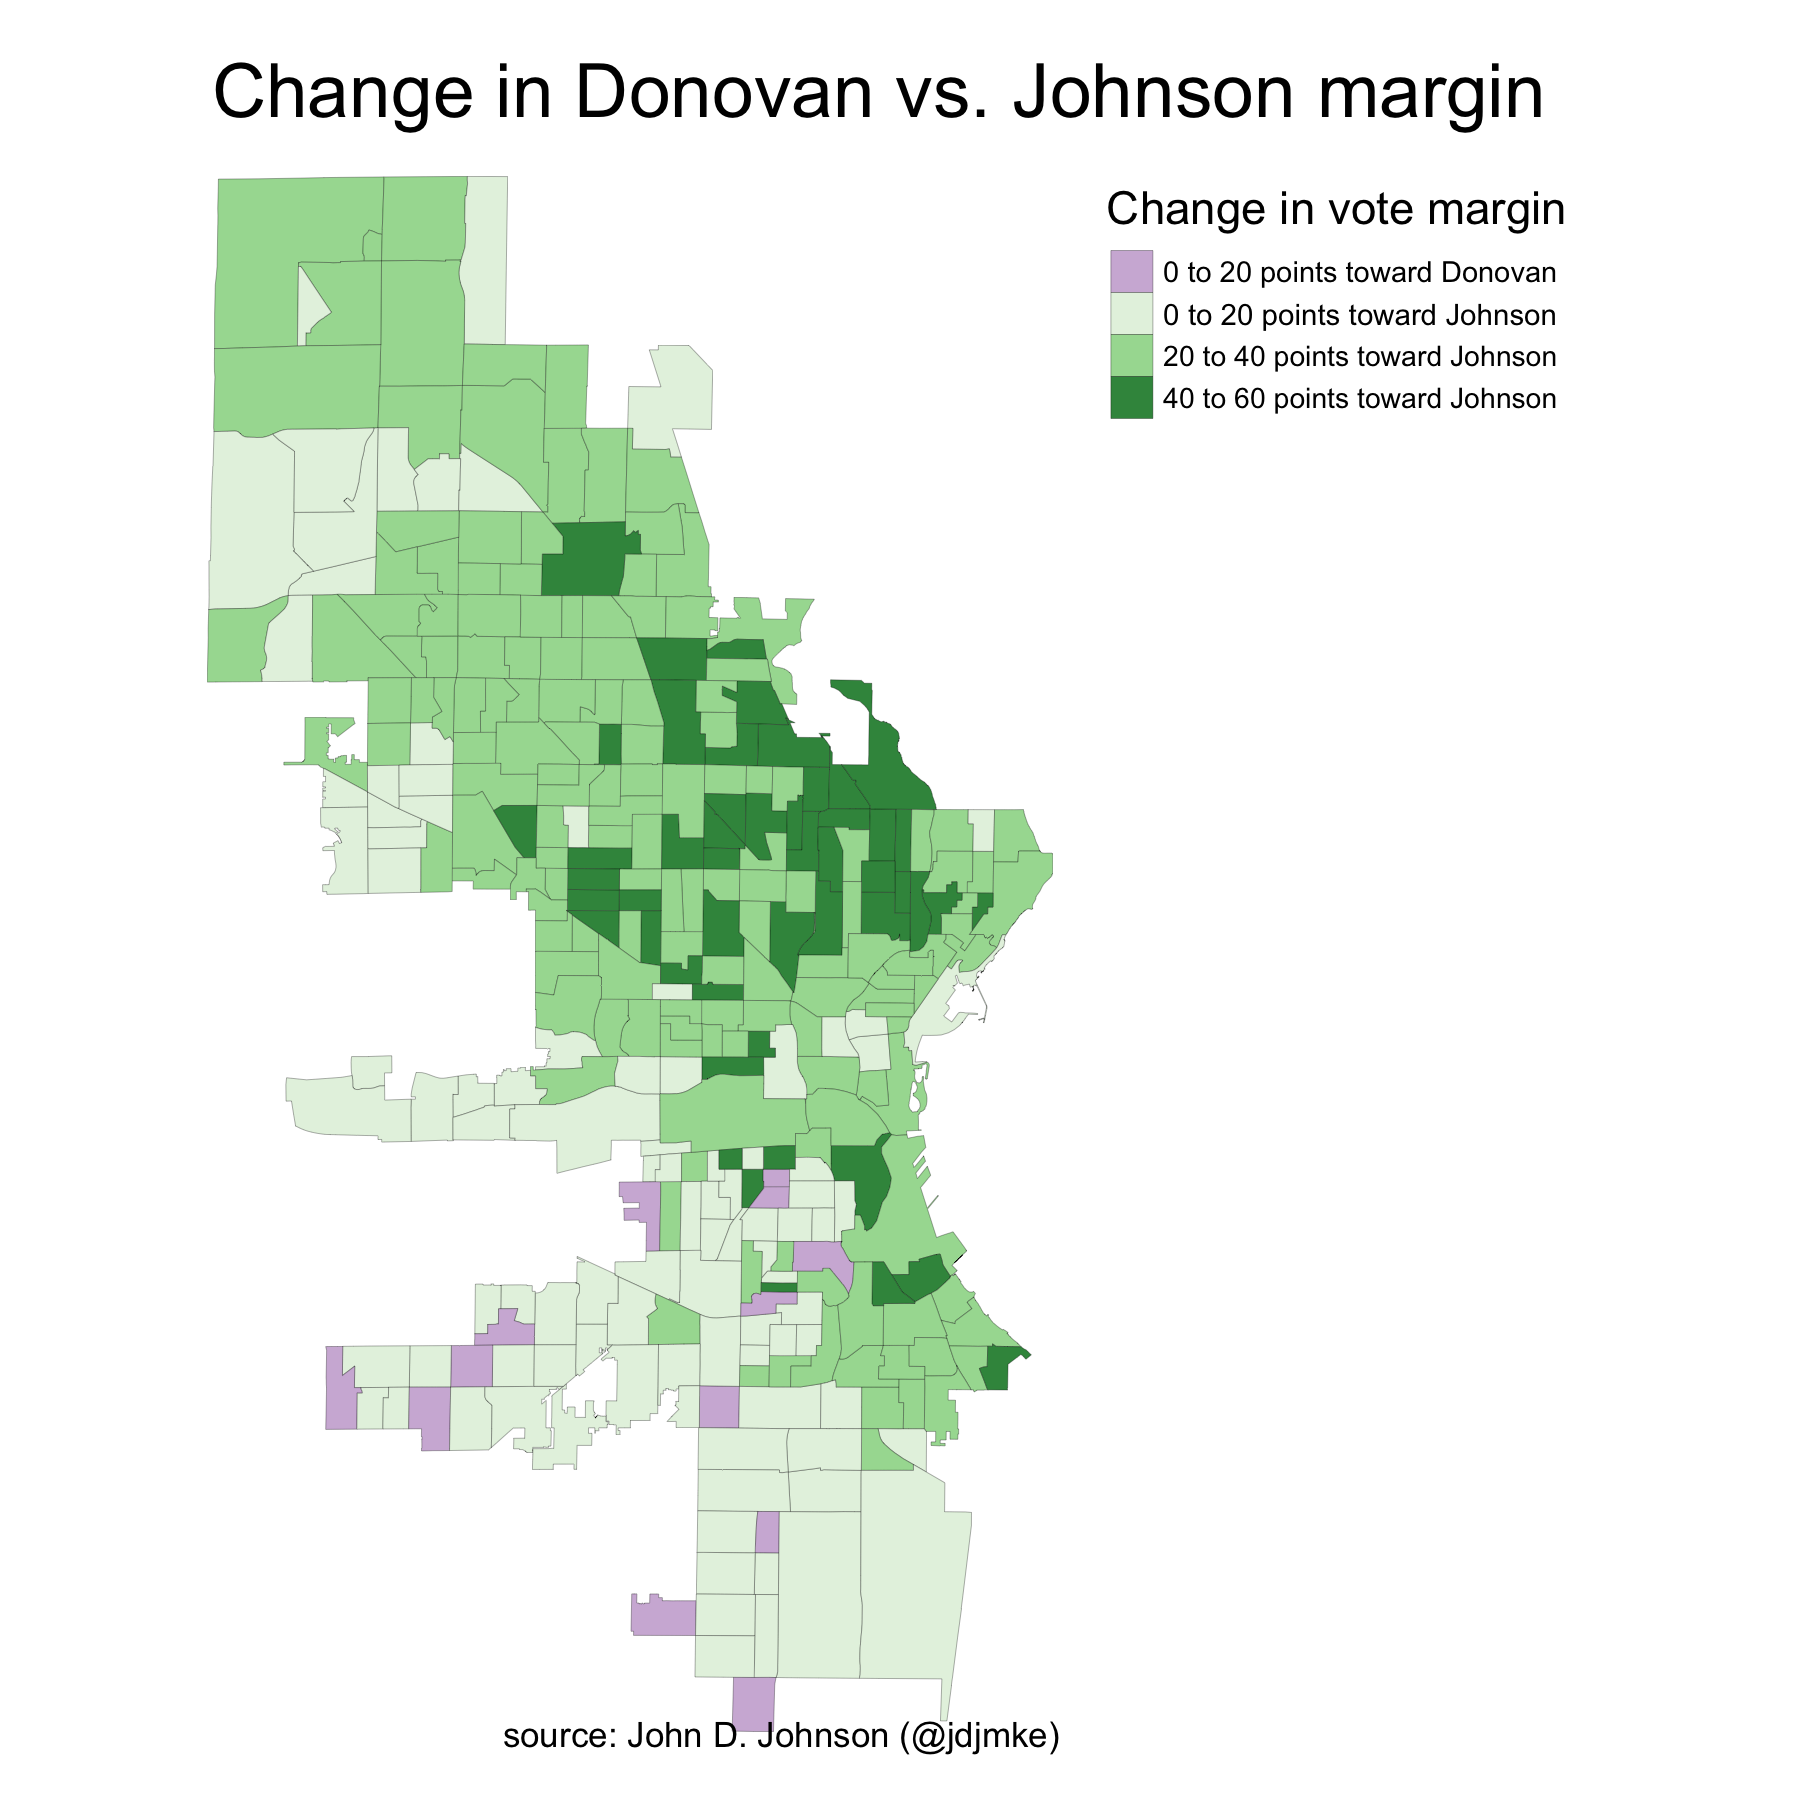
Change in Donovan vs. Johnson margin
This table shows Johnson and Donovan’s primary and general election vote shares for each aldermanic district. Donovan improved his vote share by, at most, eight percentage points. In a particularly striking example of Donovan’s limited appeal, the 15th district, he only received 4% more of the overall vote in the general election. By contrast, Johnson improved his share in that district from 49% to 91%.
| Milwaukee Mayoral Election Results by Aldermanic District | ||||||
| unofficial results tabulated in new Aldermanic districts drawn after the 2020 census | ||||||
| primary | general | change | ||||
| Donovan | Johnson | Donovan | Johnson | Donovan | Johnson | |
| 1 | 8% | 47% | 13% | 87% | 5% | 40% |
| 2 | 11% | 51% | 16% | 83% | 5% | 32% |
| 3 | 11% | 45% | 16% | 84% | 5% | 38% |
| 4 | 13% | 49% | 20% | 80% | 7% | 31% |
| 5 | 25% | 43% | 32% | 68% | 7% | 24% |
| 6 | 5% | 46% | 9% | 90% | 5% | 44% |
| 7 | 6% | 49% | 11% | 89% | 5% | 40% |
| 8 | 48% | 26% | 53% | 46% | 5% | 20% |
| 9 | 16% | 47% | 24% | 76% | 8% | 29% |
| 10 | 24% | 44% | 30% | 70% | 6% | 26% |
| 11 | 50% | 32% | 56% | 44% | 6% | 12% |
| 12 | 28% | 35% | 36% | 63% | 8% | 28% |
| 13 | 48% | 30% | 54% | 46% | 6% | 15% |
| 14 | 25% | 34% | 30% | 70% | 6% | 35% |
| 15 | 4% | 49% | 8% | 91% | 4% | 43% |
Johnson’s widespread support
I’ve written elsewhere about former Mayor Barrett’s shifting political coalitions. Barrett’s most consistent base of support was in the majority-white neighborhoods along the lake. When he ran against Black candidates, who generally did well on the north side, he added the support of more conservative white voters on the far south and southwest sides. But when he ran against conservative white candidates (i.e. Donovan in 2016), Barrett lost the far south neighborhoods and won strong support from north side voters.
Cavalier Johnson essentially replicated Barrett’s 2016 coalition against Bob Donovan’s first campaign for mayor. In fact, Johnson improved on Barrett’s performance in 11 out of 15 Aldermanic districts. Donovan only improved his performance relative to 2016 in those parts of the city which were already his base of support – the 8th, 11th, 12th and 13th districts on the south and southwest sides.Johnson won all 134 wards where a majority of adults are Black, and 76 of the 107 majority-white wards. Donovan won 22 of 41 majority Hispanic wards, but due to differing rates of eligibility and participation it would be wrong to assume that he won a majority of Hispanic voters.
The table below compares Bob Donovan’s vote share in the 2016 general election to his share in the 2022 general election. I’ve aggregated each election into 2022 Aldermanic districts.1
| Bob Donovan’s Mayoral Vote Share by Aldermanic District | |||
| results tabulated in new aldermanic districts drawn after the 2020 census | |||
| general election vote share | |||
| 2016 | 2022 | change | |
| 1 | 15% | 13% | −2% |
| 2 | 19% | 16% | −2% |
| 3 | 22% | 16% | −6% |
| 4 | 26% | 20% | −6% |
| 5 | 37% | 32% | −4% |
| 6 | 12% | 9% | −3% |
| 7 | 13% | 11% | −2% |
| 8 | 48% | 53% | 6% |
| 9 | 25% | 24% | −2% |
| 10 | 32% | 30% | −2% |
| 11 | 55% | 56% | 1% |
| 12 | 33% | 36% | 3% |
| 13 | 53% | 54% | 2% |
| 14 | 35% | 30% | −5% |
| 15 | 13% | 8% | −5% |
Turnout
Thirty-one percent of registered voters cast a ballot in this election, up from 22% in February. Twenty-two percent of adult citizens voted, compared with 15% in the primary. Not all adult citizens are eligible to vote, so the “eligible voter” participation rate is somewhere between these two numbers.
Thirty-one percent of registered voters also cast a ballot in the 2020 mayoral election, which took place during the early days of the pandemic. In 2016, turnout was 53%. Direct comparison is complicated because regularly-scheduled mayoral elections coincide with presidential primaries. Perhaps a better comparison is Milwaukee’s last open race for mayor in 2004. In that year, the presidential primary coincided with the mayoral primary, not the spring general election. In the spring general, 46% of registered voters cast a ballot.
Across the country, turnout in mayoral elections averages about 15% of adult citizens, so Milwaukee’s turnout is actually somewhat above average.
Still, Milwaukee’s 31% turnout is the lowest in an open race for mayor since at least 1900, according to research by Marquette professor Philip Rocco. On the other hand, Johnson’s landslide vote share is also the largest victory by a first-term mayor over that period.2 Johnson enters his first elected term with both the proportionally smallest electorate of any newly elected mayor and the strongest support of any new mayor within that electorate.
- See here for details on how I handled new ward boundaries.↩︎
- Barrett won election with 54% in 2004. John Norquist won 54% in 1988. Henry Maier won 58% in 1960. Frank Zeidler won 56% in 1948. John Bohn won 54% in 1944. Carl Zeidler won 53% in 1940. Daniel Hoan won 51% in 1916. Gerhard Bading won 59% in 1912. Emil Seidel won 46% in 1910. David Rose won 37% in 1908, and Sherburn Becker won 37% in 1906.↩︎
If you think stories like this are important, become a member of Urban Milwaukee and help support real, independent journalism. Plus you get some cool added benefits.
More about the 2022 Mayoral Race
- Johnson Carried 81% of City’s Wards - John D. Johnson - Apr 6th, 2022
- Meet Milwaukee’s New Mayor Cavalier Johnson - Jeramey Jannene - Apr 5th, 2022
- Where Mayoral Candidates Stand On Issues - Matt Martinez - Apr 3rd, 2022
- What Do Milwaukee Mayors Do? - Milwaukee Neighborhood News Service - Apr 3rd, 2022
- Acting Mayor Johnson’s Brother Arrested On Felony Charges - Jeramey Jannene - Apr 1st, 2022
- Hundreds watch parent-led virtual listening sessions on K-12 education with mayoral candidates - City Forward Collective - Mar 30th, 2022
- Murphy’s Law: Let’s Not Whitewash Bob Donovan - Bruce Murphy - Mar 28th, 2022
- Donovan, Johnson Clash On Drop Boxes - Jeramey Jannene - Mar 22nd, 2022
- Bob Donovan vs The Clown - Jeramey Jannene - Mar 22nd, 2022
- Donovan Plans Car Theft “Strike Force” - Jeramey Jannene - Mar 21st, 2022
Read more about 2022 Mayoral Race here
Political Contributions Tracker
Displaying political contributions between people mentioned in this story. Learn more.


Crazy that Johnson received this much support considering the disaterous violence going in in the city under his watch.
Again the reason for the violence is poverty. Poverty that Republicans and conservatives like to make worse to give their racist base like the guy above me red meat.