Data Shows Sweep of Johnson’s Victory
Won 12 of 15 aldermanic districts, 216 out of 315 wards in mayor's race, did well even in Donovan's best district.
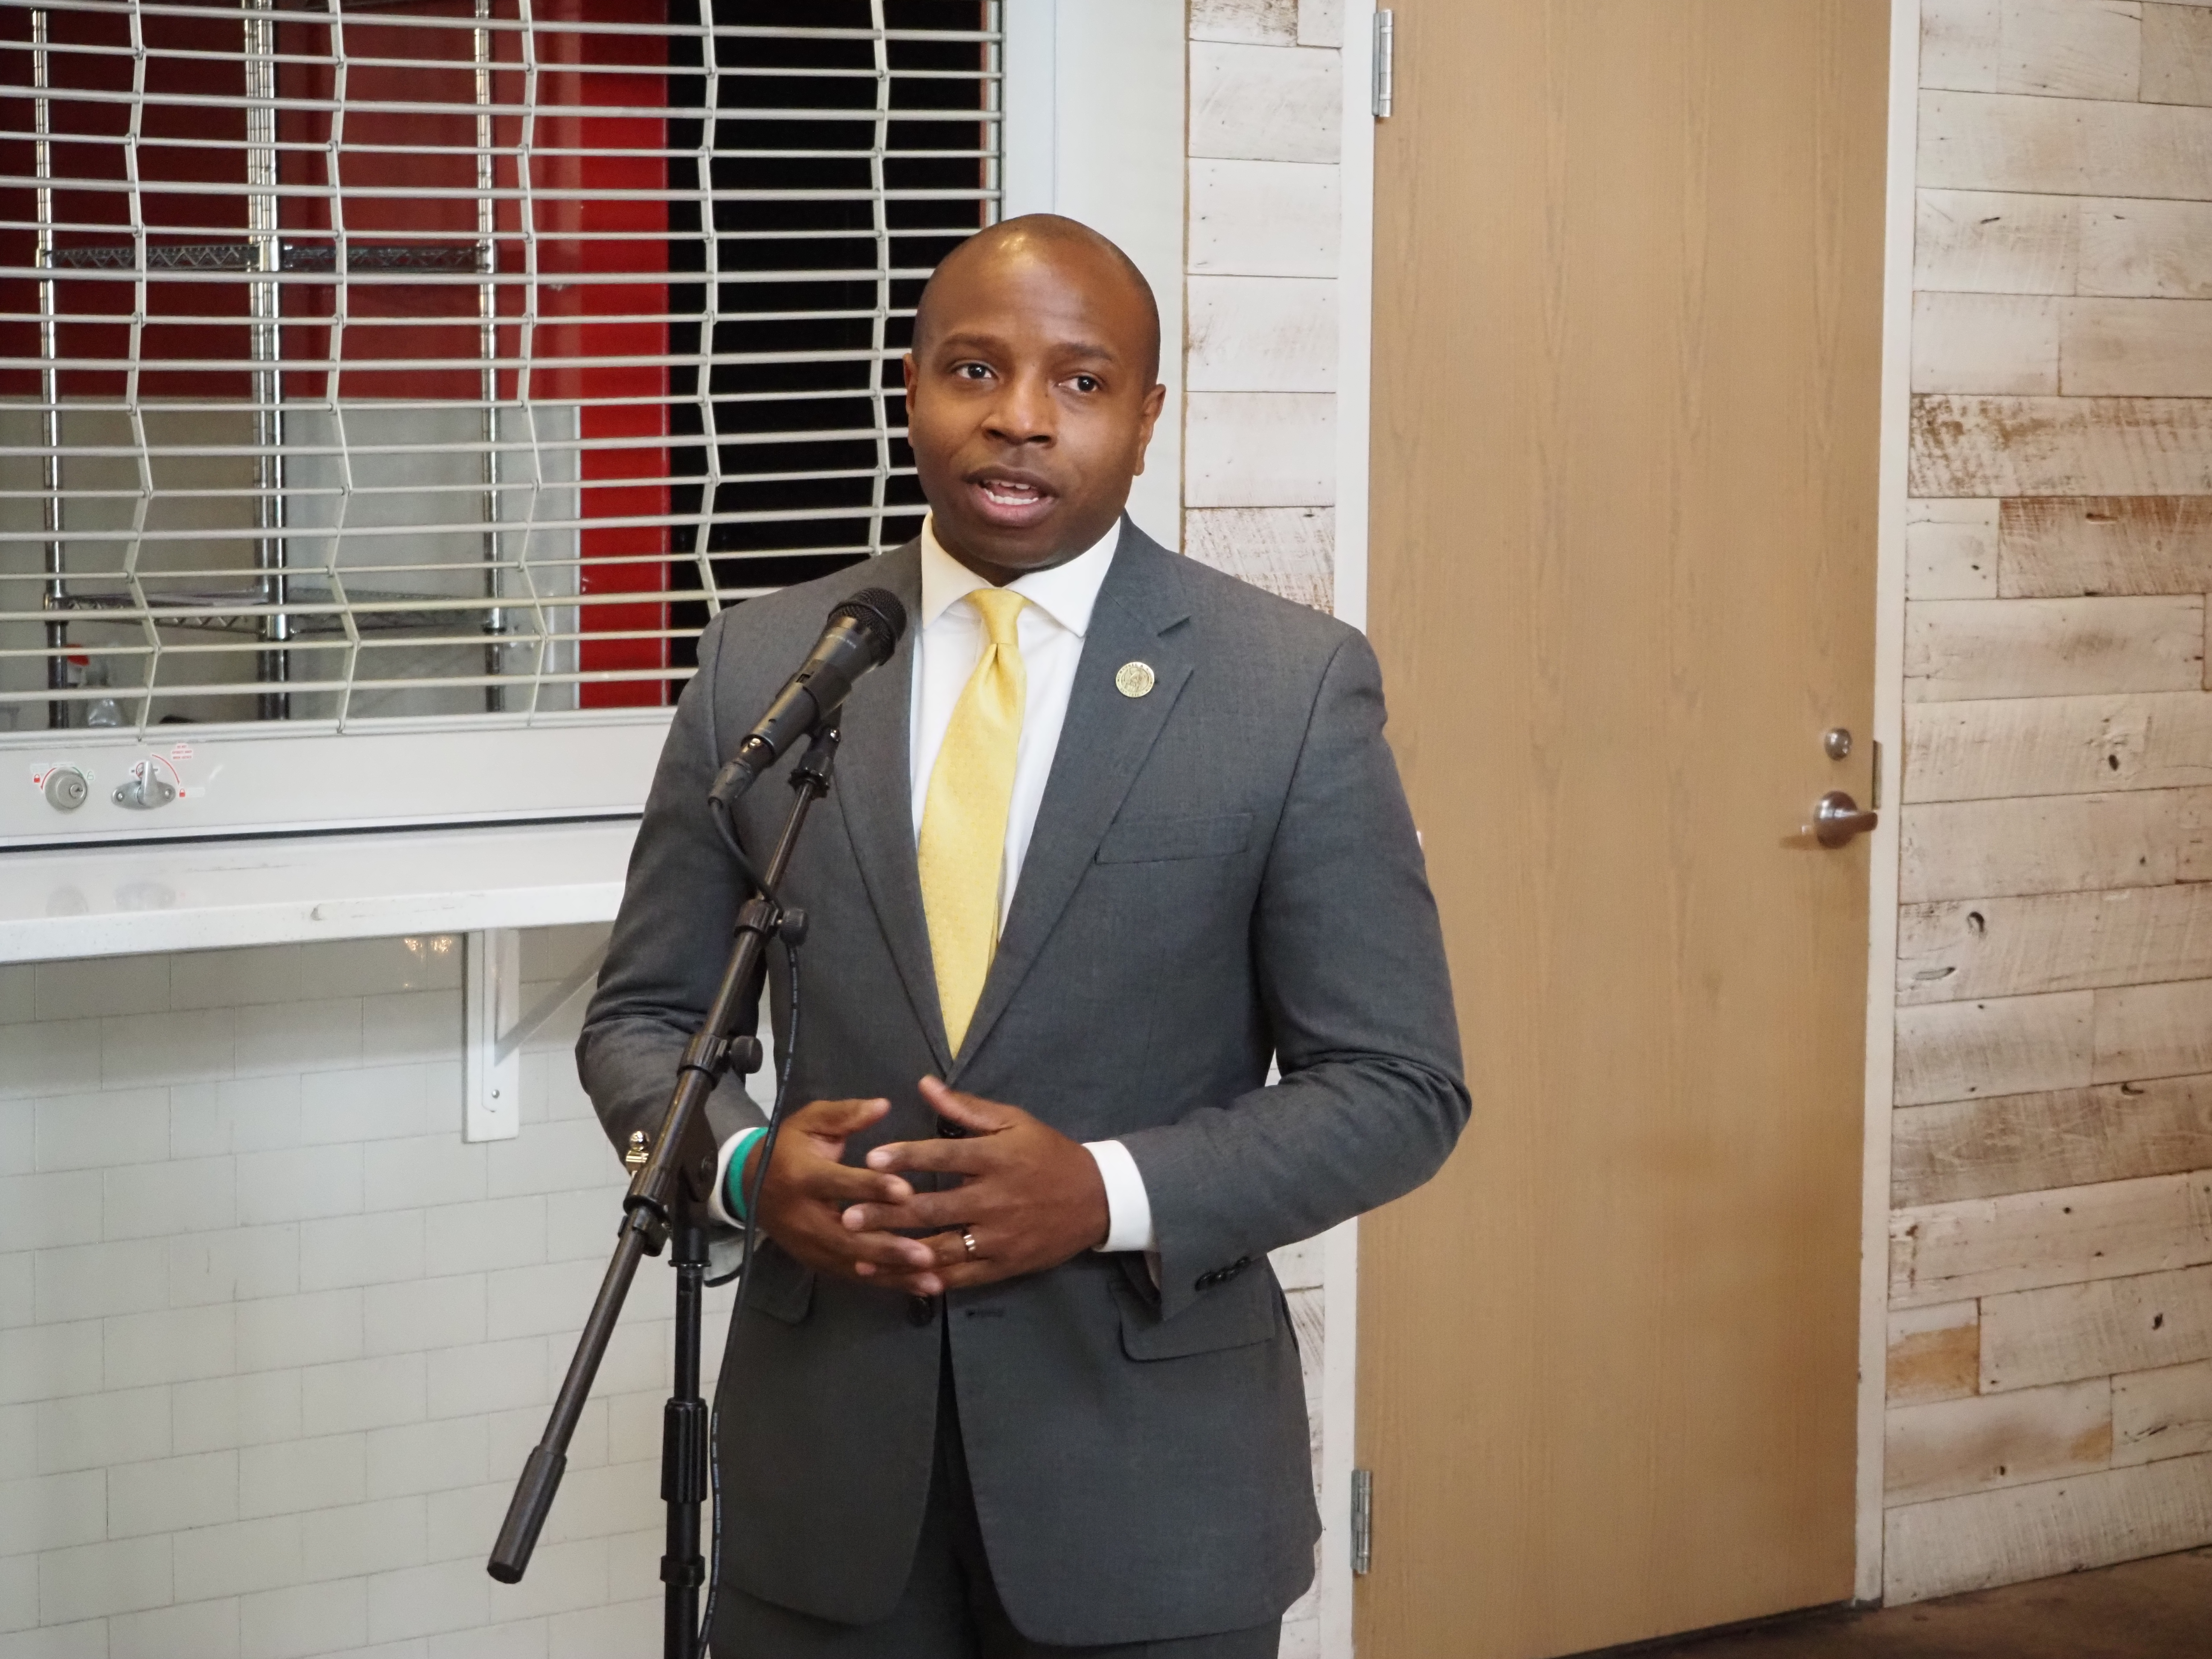
Cavalier Johnson. File photo by Jeramey Jannene.
In Tuesday’s mayoral primary, Acting Mayor Cavalier Johnson romped to first place with strong showings across the north, west, and east sides of the city. Out of seven candidates on the ballot, more than four-in-ten chose Johnson. Retired Alderman Bob Donovan will join him in the general election. This is the second time Donovan has advanced to the general election. But, in comparison to 2016, his performance this year was much weaker.
In 2016’s primary, Donovan won 32% of the vote, compared to 22% this year. Nonetheless, Donovan’s hold on second-place wasn’t really challenged because the remaining 35% of the electorate closely divided itself between State Senator Lena Taylor (13%), Alderwoman Marina Dimitrijevic (12%), and Sheriff Earnell Lucas (10%).
In total, Johnson carried 216 out of 317 wards. Donovan won the vote in 85 wards, while Taylor picked up six and Dimitrijevic five. On the level of aldermanic districts, Johnson won 12 to Donovan’s three.
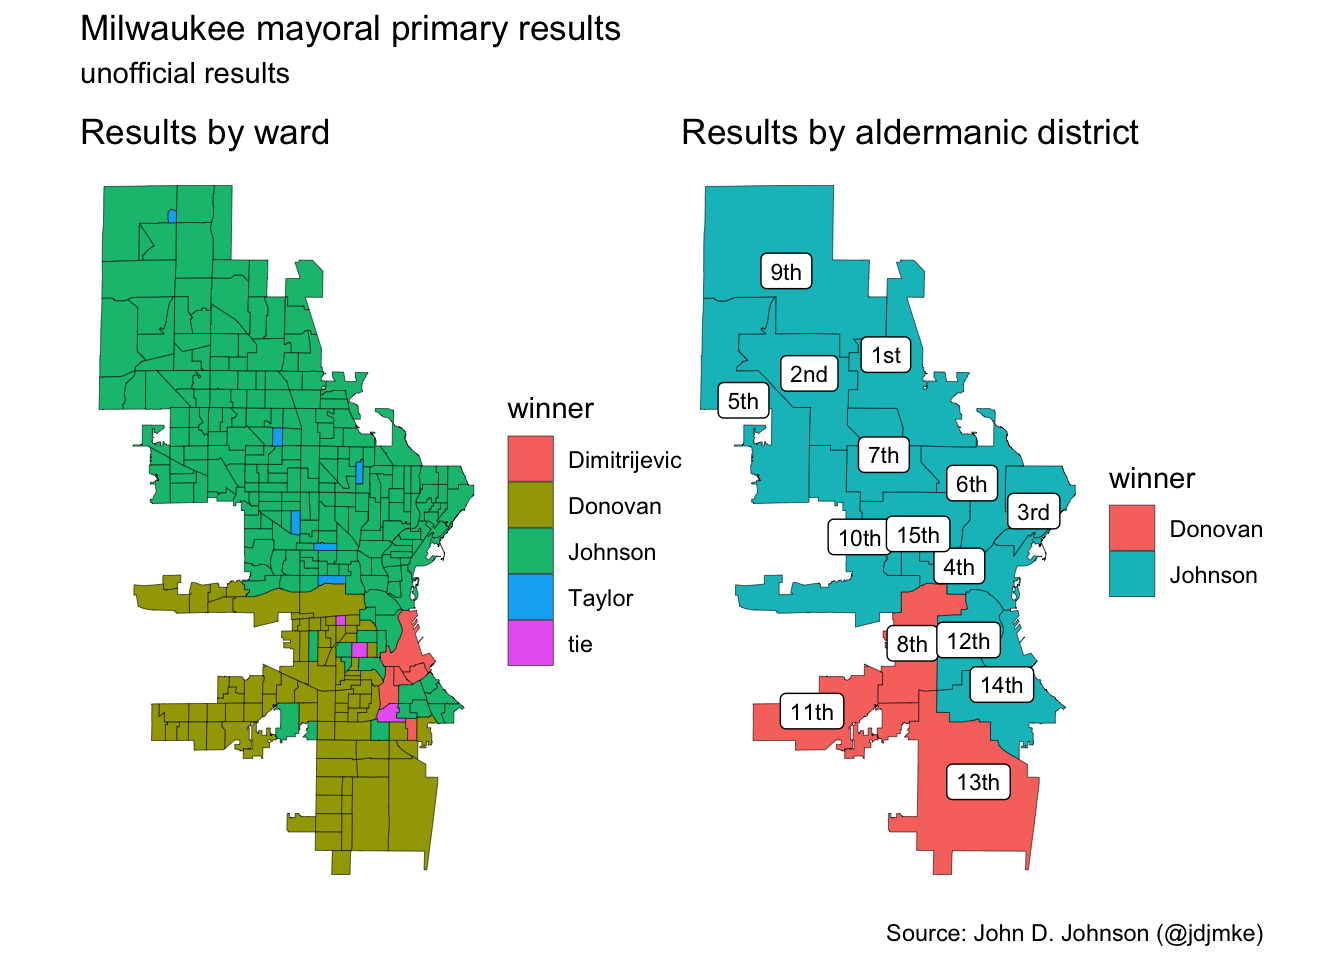
Milwaukee mayoral primary results (unofficial results).
The maps below show the performance of each major candidate by ward.
Dimitrijevic performed noticeably better east of I-43 than anywhere else. She won 31% of the vote in her own 14th district and 24% in the 3rd district, which covers the Upper East Side.Donovan’s support came overwhelmingly from the far south and southwest sides of the city–essentially the majority white parts of the city where Dimitrijevic did more poorly. He won 50% of the 11th district and 48% of both the 8th and 13th districts.
Johnson’s strongest performance came in his home district, the second, where he got 51%. His support was more evenly spread across the city. In no district did he receive less than a quarter of the vote.
By contrast, Taylor’s high water mark was 27% in the 1st district, which largely overlaps with her state senate seat. Lucas’ best result was 16% in the 7th district.

Milwaukee mayoral primary results among leading candidates (unofficial results).
Here is a table showing the candidates’ vote shares in each of Milwaukee’s aldermanic districts.
| Milwaukee Mayoral Primary Election Results by Aldermanic District | |||||||
| unofficial results tabulated in new aldermanic districts drawn after the 2020 census | |||||||
| Johnson | Donovan | Taylor | Dimitrijevic | Lucas | Sampson | Griffin | |
| 1 | 47% | 8% | 27% | 2% | 15% | 0% | 0% |
| 2 | 51% | 11% | 21% | 2% | 14% | 0% | 0% |
| 3 | 45% | 11% | 9% | 24% | 8% | 1% | 1% |
| 4 | 49% | 13% | 10% | 14% | 11% | 2% | 1% |
| 5 | 43% | 25% | 12% | 7% | 11% | 1% | 0% |
| 6 | 46% | 5% | 25% | 10% | 12% | 1% | 1% |
| 7 | 49% | 6% | 25% | 3% | 16% | 0% | 1% |
| 8 | 26% | 48% | 6% | 15% | 4% | 1% | 0% |
| 9 | 47% | 16% | 18% | 4% | 13% | 1% | 0% |
| 10 | 44% | 24% | 8% | 14% | 8% | 1% | 0% |
| 11 | 32% | 50% | 3% | 8% | 5% | 1% | 0% |
| 12 | 35% | 28% | 8% | 20% | 5% | 2% | 1% |
| 13 | 30% | 48% | 4% | 12% | 5% | 1% | 0% |
| 14 | 34% | 25% | 4% | 31% | 4% | 1% | 0% |
| 15 | 49% | 4% | 26% | 4% | 15% | 0% | 1% |
Even within his geographic base, fewer people voted for Bob Donovan in 2022 than last time he ran in 2016, as the maps below show.
Turnout in this primary was similar to that of Donovan’s first race for mayor. This time, 22% of registered voters cast a ballot, and 14% of Milwaukee adults voted (of course, not all adults are eligible to vote). By comparison, 23% of registered voters participated in 2020 and 21% in 2016.
Turnout tends to increase for the general election–something which hurt Donovan last time. His vote share actually shrank in April relative to February. But these comparisons are tricky. In 2016, the spring general election coincided with a presidential preference vote for both Democrats and Republicans. Those hotly contested elections helped boost April election turnout to 52%.

Bob Donovan’s vote share in Milwaukee mayor primaries
One of the most remarkable features of this election is the breadth of Johnson’s coalition–something that stands in stark contrast with that of his general election opponent.
While Donovan’s support was mostly limited to a few parts of the city, Johnson’s was not. Consider this. Both Johnson and Donovan received about half the vote in their best districts. In Donovan’s strongest performing district, Johnson also received about a third of the vote. In Johnson’s best district, Donovan only got a tenth.
]Donovan won 0 majority Black wards. Johnson, in addition to winning 129 out of 134 majority Black wards, also won 58 majority white wards. In fact, Johnson won more majority white wards than Donovan.I’ve written elsewhere about how race shaped Milwaukee’s past mayoral elections. Tom Barrett enjoyed a strong base of support in the majority white, politically progressive neighborhoods stretching along the lake. Other parts of the city alternately opposed or supported him, depending on his challenger. When he ran against a Black candidate (Taylor and Pratt), the more conservative far southern and southwestern parts of the city would vote for him in large numbers. When he ran against a more conservative candidate (Donovan or Zielinski), the North Side would back him just as strongly.
The division between the mostly white East Side and the mostly Black North Side has characterized many other recent elections as well, including the 2020 county executive race and various Democratic party primaries. All this makes Johnson’s performance in this primary more remarkable. Even with seven candidates to choose from, a plurality of voters in 12 of Milwaukee’s 15 aldermanic districts picked him first.
More about the 2022 Mayoral Race
- Johnson Carried 81% of City’s Wards - John D. Johnson - Apr 6th, 2022
- Meet Milwaukee’s New Mayor Cavalier Johnson - Jeramey Jannene - Apr 5th, 2022
- Where Mayoral Candidates Stand On Issues - Matt Martinez - Apr 3rd, 2022
- What Do Milwaukee Mayors Do? - Milwaukee Neighborhood News Service - Apr 3rd, 2022
- Acting Mayor Johnson’s Brother Arrested On Felony Charges - Jeramey Jannene - Apr 1st, 2022
- Hundreds watch parent-led virtual listening sessions on K-12 education with mayoral candidates - City Forward Collective - Mar 30th, 2022
- Murphy’s Law: Let’s Not Whitewash Bob Donovan - Bruce Murphy - Mar 28th, 2022
- Donovan, Johnson Clash On Drop Boxes - Jeramey Jannene - Mar 22nd, 2022
- Bob Donovan vs The Clown - Jeramey Jannene - Mar 22nd, 2022
- Donovan Plans Car Theft “Strike Force” - Jeramey Jannene - Mar 21st, 2022
Read more about 2022 Mayoral Race here
Political Contributions Tracker
Displaying political contributions between people mentioned in this story. Learn more.