
Census Data Shows Changing Milwaukee Demographics
Fewer white residents citywide, but shrinking population totals in many majority-Black neighborhoods.
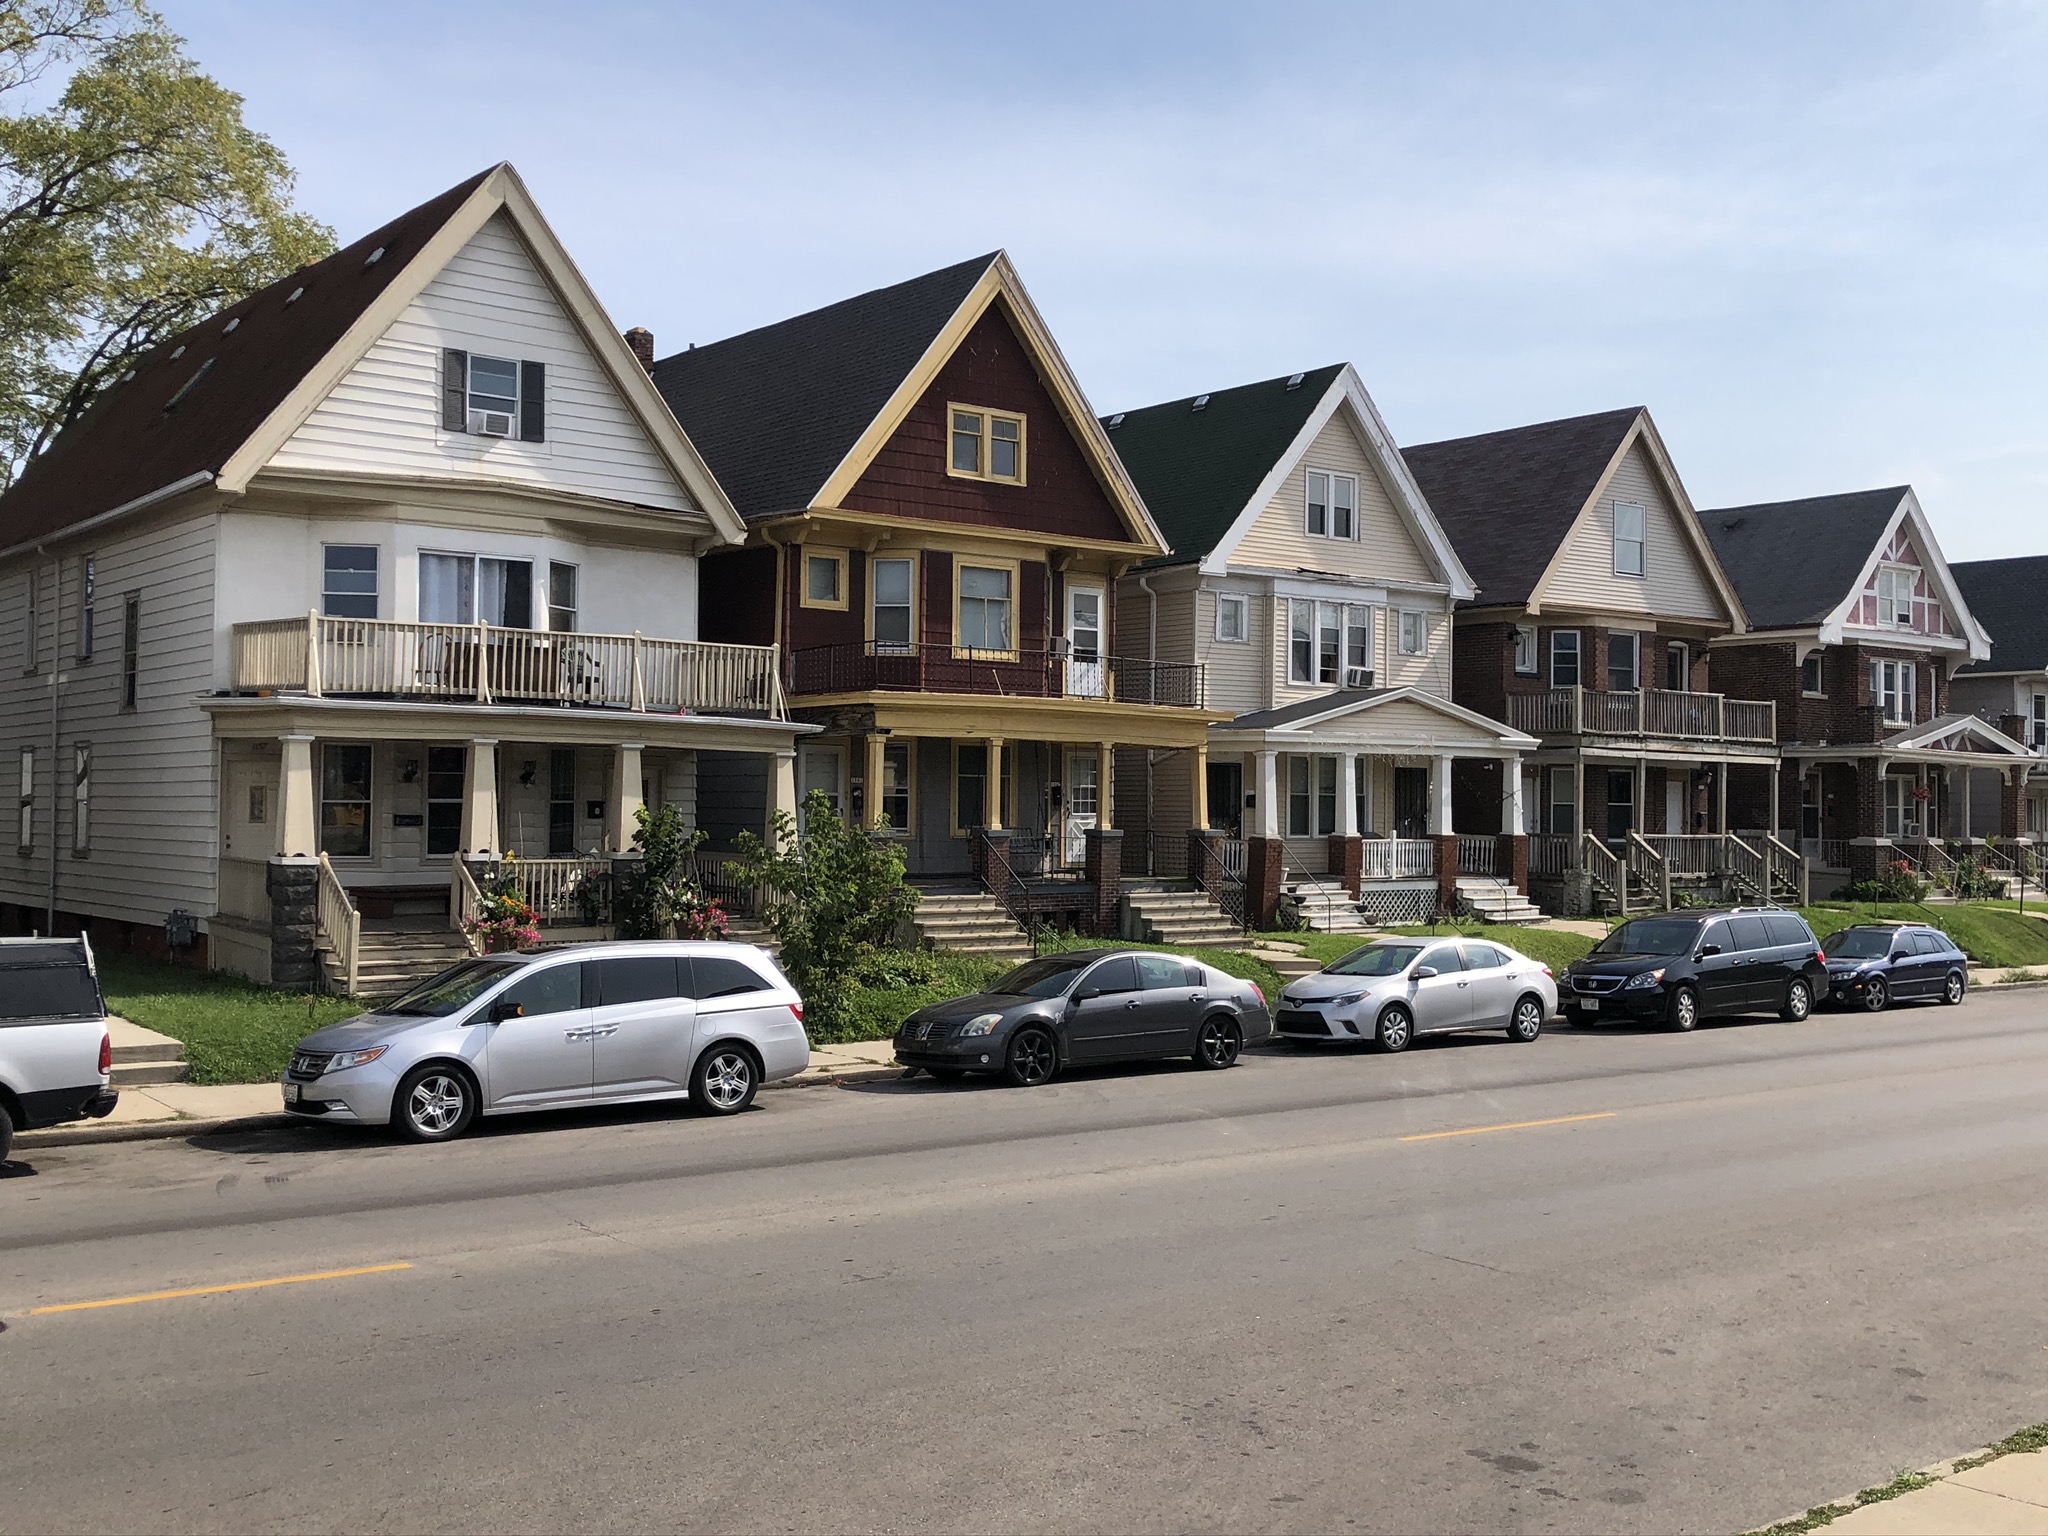
Houses on W. Windlake Ave. Photo by Jeramey Jannene.
The headline of the 2020 Census is that Milwaukee lost 17,611 residents in the past 10 years, falling to 577,222 residents from 594,833. But focusing only on that figure would miss a lot of changing neighborhoods and major demographic swings.
Four of the city’s 15 aldermanic districts gained residents. At the same time, two of the districts lost more than 10% of their residents. Almost paradoxically, the two districts that gained the most residents directly border those that lost the most.
The fastest-growing district is Alderman Nik Kovac‘s 3rd aldermanic district. It gained 2,106 residents (6.1%), including more than 5% growth in voting wards that encompass portions of the Lower East Side, Riverwest and Downer Woods neighborhoods. Only a single ward, which encompasses part of the UW-Milwaukee campus, lost more than 5% of its residents. It remains the district with the highest percentage of white residents at 76.3% (down from 81.1%).The second-fastest growing area is Ald. Robert Bauman‘s 4th aldermanic district (1,741 residents, 4.5%), which includes Downtown and the Near West Side to N. 35th St. The Downtown portion of the district saw substantial growth, much of which can be attributed to new housing development, while the western half has five wards that lost at least 5% of their residents.
Meanwhile, the fastest-shrinking neighborhoods are those just north of Bauman’s district and just west of Kovac’s district.
The 15th district, represented by Ald. Russell W. Stamper, II, lost 12.3% of its residents (4,804). The district, which roughly runs from W. Burleigh St. to W. McKinley Ave and Interstate 43 to N. 51st St., saw only a single ward grow by more than 1%. It has historically had the lowest property values in the city and one of the highest concentrations of Black residents.
The 6th district, represented by Alderwoman Milele A. Coggs, lost 10.6% of its residents (4,196). The district includes the Beerline, Brewers Hill, Harambee, Halyard Park, Borchert Field, Bronzeville and Williamsburg Heights neighborhoods, as well as the westernmost part of Riverwest. But unlike the 15th district’s near-universal population loss, the 6th district gained residents at its southern edge near Fiserv Forum. The three southernmost wards grew by more than 5% each.
Inside City Hall, a debate is underway on which of the more than 300 wards should be assigned to different aldermanic districts (or redrawn). A similar process is playing out at the county level.
Kovac and Bauman’s districts must shrink, while Stamper and Coggs’ must grow in size. It’s a situation that isn’t unfamiliar to those involved. Stamper’s district (then represented by Willie Hines, Jr.) lost 12.8% of its residents according to the 2010 Census. Coggs’ 6th District was third-worst that time, losing 6.4% of its residents.
Racial Shakeup
The City of Milwaukee also continues to move further from having a majority racial or ethnic group, a trend now decades in the making.
Those identifying as Black, according to Census data, fell from 40.3% in 2010 to 39.3%. Those identifying as White (Non-Hispanic) fell even more, from 37% to 32.3%.
But those statistics are for all ages, not just individuals old enough to vote. When looking at individuals ages 18 or older, a different picture emerges.
A Legislative Reference Bureau report indicates that the share of city residents that are old enough to vote and Black grew slightly from 36% to 36.1%. The white population loss is greatest among those old enough to vote, with white adults going from 44.6% to 38.6% of Milwaukee’s adult population.
The Ever-Changing South Side
Milwaukee’s population change wasn’t limited to the Near North Side and Downtown. Two southside districts saw substantial growth, while a district that was the fastest-growing in 2010 lost residents over the ensuing decade.
The 13th district, represented by Ald. Scott Spiker, is known as The Garden District and includes the city’s southernmost neighborhoods. It grew by 4.4% in the past decade. There isn’t a substantial amount of new housing to attribute that to, but it has seen substantial demographic shifts.
The white population fell from 63.3% to 49.4%, while the Asian population went from 4.3% to 10.2%. Its Black and Hispanic population also grew from 3.8% and 26.9% to 6.9% and 30.9%.
A similar situation is occurring on the southwest side’s 11th aldermanic district represented by Ald. Mark Borkowski. It grew by 3.9% in the past decade with no substantial housing development to explain a surge in residents. It also saw a substantial drop in its white population.The percentage of residents identifying as white fell from 72.4% to 57.6%. Its residents are now 6.8% Black, 27% Hispanic and 5.4% Asian, that’s up from 4.9%, 18.1% and 2.9% respectively. It is still the second whitest district in the city, but minor changes with its boundaries could push it to the middle of the pack.
The 8th aldermanic district, which runs Interstate 94 south to approximately W. Cleveland Ave. and west from S. 20th St. to the city limits, also lost a substantial number of white residents, including its council representative. It’s now represented by Ald. JoCasta Zamarripa. Former alderman Robert Donovan retired in 2020 and purchased a home in Greenfield (but says he will move back to Milwaukee to run for mayor).
It was the fastest-growing district in 2010, expanding its population by 9.5%. By 2020, with new boundaries, it shrunk by 6.2%.
It’s also now the leading Hispanic district in the city, eclipsing Ald. Jose G. Perez‘s 12th aldermanic district to the east. The district is now 73.3% Hispanic, up from 63% and ahead of Perez’ 69.6% (down from 71.6%). Its white population fell from 24.8% to 13.3%, while its Black (7.7%) and Asian (3.5%) population totals held steady.
What does this all mean for city politics? Besides the shrinking influence of white voters, that’s hard to say. The Common Council is expected to begin publicly reviewing new district plans in October.
For a look at the county process, see coverage from my colleague Graham Kilmer.
Maps and Statistics
- 2000 to 2010 Population Change by Aldermanic District
- 2010 to 2020 Population Change by Aldermanic District
- 2020 Population Change by Wards
- 2020 Aldermanic District Demographics
All maps from the city’s Legislative Reference Bureau.
If you think stories like this are important, become a member of Urban Milwaukee and help support real, independent journalism. Plus you get some cool added benefits.
Political Contributions Tracker
Displaying political contributions between people mentioned in this story. Learn more.
- December 13, 2018 - José G. Pérez received $50 from Mark Borkowski
- March 31, 2018 - Bob Donovan received $50 from Mark Borkowski
- September 8, 2015 - Bob Donovan received $50 from Mark Borkowski
- May 5, 2015 - José G. Pérez received $100 from JoCasta Zamarripa
City Hall
-
Menomonee Falls Could Get More Milwaukee Water
 Mar 11th, 2026 by Jeramey Jannene
-
Mayor Signs ‘Sanctuary City’ Resolution, With Key Caveat
 Mar 9th, 2026 by Jeramey Jannene
-
City Tows Hundreds With Unpaid Parking Citations
 Feb 25th, 2026 by Jeramey Jannene


Two questions:
1) Wouldn’t now be a good time to completely re-draw all the districts in order to make them as racially and economically diverse as practical? It seems like low-income citizens and high-income citizens are currently packed in separate places.
2) Maybe I do not understand the process, but this article seems to indicate that City Hall and the Common Council are in charge of making the new district plans. Isn’t this like allowing the politicians to choose their voters, a complaint we often make about gerrymandering at the state level?
Follow-up to previous comment:
Yes, the politicians in the City of Milwaukee chose their voters. Here’s how it works:
According to a recent article by the Milwaukee Journal Sentinel, “Redistricting Beginning in City, County” (09/05/2021), the city’s redistricting will be performed by the Common Council’s Judiciary and Legislation Committee with assistance from staff at the city’s Legislative Reference Bureau.
The Judiciary and Legislative Committee is not independent and unbiased. It consists of five Common Council members. Presently, these are the following aldermen: Bauman, Dodd, Hamilton, Murphy and Spiker.
Even their support is not independent and unbiased. The Legislative Reference Bureau staff members ultimately report to the City Clerk, and the City Clerk is appointed by the Common Council to a four-year term.
From my understanding, the entire redistricting process for the City of Milwaukee is controlled by the Common Council. In other words, they chose their voters. Please let me know if I’ve got this wrong.