
DNR Shares Results From Summer 2022 Milwaukee Heat Mapping Campaign
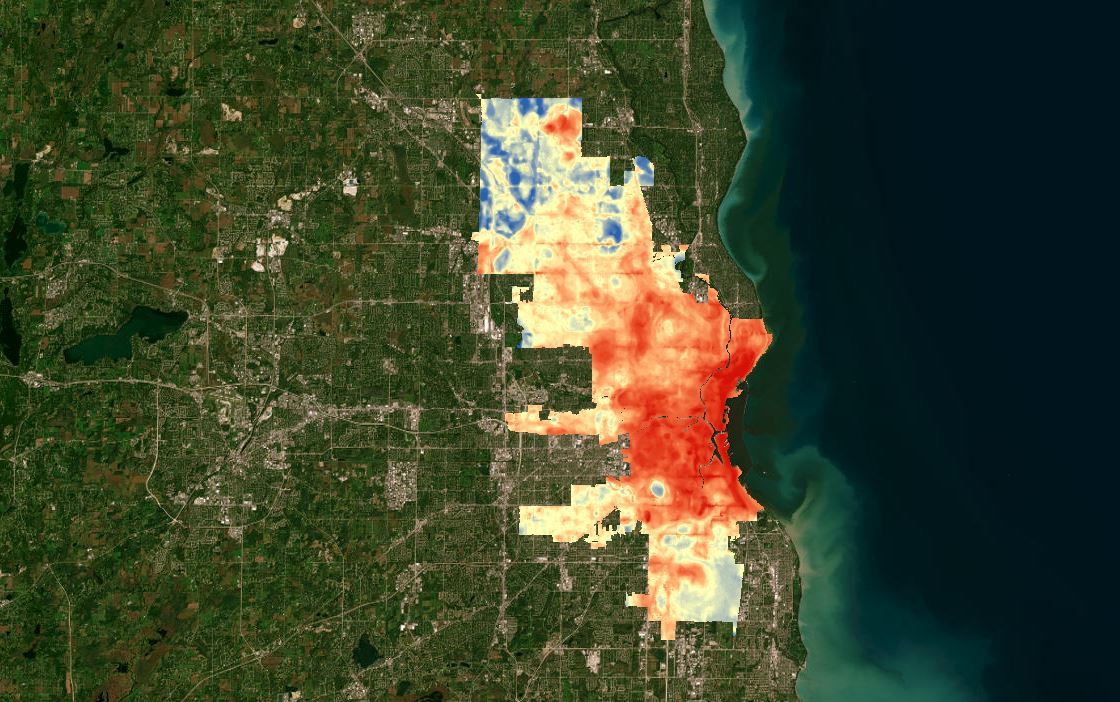
Air temperature data collected in the city of Milwaukee demonstrates the urban heat island effect, where densely developed urban areas tend to be warmer than more open rural spaces. / Photo Credit: Wisconsin DNR
MADISON, Wis. – The Wisconsin Department of Natural Resources (DNR) today announced that results from a heat mapping campaign conducted in the summer of 2022 are now available. The campaign was coordinated by the DNR, Groundwork Milwaukee and the Milwaukee Metropolitan Sewerage District.
The resulting map shows air temperature data collected in the city of Milwaukee from July 21-22, 2022, by citizen scientists using car-mounted sensors. The mapping campaign recorded a 10-degree difference in the evening between the hottest and coolest parts of the city, with the hottest spots in dense urban areas.
Densely developed urban areas tend to be warmer than more open rural spaces due to the concentration of manmade surfaces that absorb and reradiate heat, such as asphalt and concrete. This phenomenon, known as the urban heat island effect, is further compounded by rising temperature trends due to climate change.The data collected in this campaign can be integrated into decision-making processes, such as prioritizing where trees or cooling centers could have the most impact.
“Trees, of course, provide shade,” said Dan Buckler, DNR Urban Forest Assessment Specialist, “but also have a profound cooling effect with their ability to move water from the ground, through their stems and out their leaves as water vapor.”
The campaign was a citizen science achievement. To efficiently map heat across the city, forty-three project participants drove vehicles along nine predetermined routes, collecting temperature and humidity data every second for about an hour. These routes were driven in the morning, afternoon and evening during two hot days in July.
“We are so grateful to all of the participants who collected data, shared their comments and spread the news about this project,” said Buckler.
Data was then analyzed by CAPA Strategies, which also provided the methodology, equipment and logistical support. Funding and additional support for the project were provided by the National Oceanic and Atmospheric Administration’s National Integrated Heat Health Information System.Find an interactive map of the temperature data, a project report and raw GIS data on the DNR’s website. Groundwork Milwaukee’s Climate Safe Neighborhoods dashboard includes the temperature and humidity maps.
Find additional resources related to climate change and urban trees on the DNR website.
NOTE: This press release was submitted to Urban Milwaukee and was not written by an Urban Milwaukee writer. While it is believed to be reliable, Urban Milwaukee does not guarantee its accuracy or completeness.
Recent Press Releases by Wisconsin Department of Natural Resources