GOP Legislative Districts Heavily White
Republican assembly districts are up to 96% white, senate districts as high as 95% white.
As Wisconsin and the nation prepare to honor civil rights leader Dr. Martin Luther King Jr., a review of U.S. Census data shows Wisconsin residents elect Republican legislators in districts with the highest percentage of white residents, and Democrats in districts with the highest ratio of non-white residents.
In the state Senate, which has 33 legislative districts, Republicans represent nine of the 11 districts with the largest proportion of whites, ranging from 92.5 percent to about 95 percent. Meanwhile, Democrats were elected in nine of the 10 senate districts with the smallest proportion of white residents, ranging from 23.4 percent to about 86 percent. (See Tables 1 & 2).
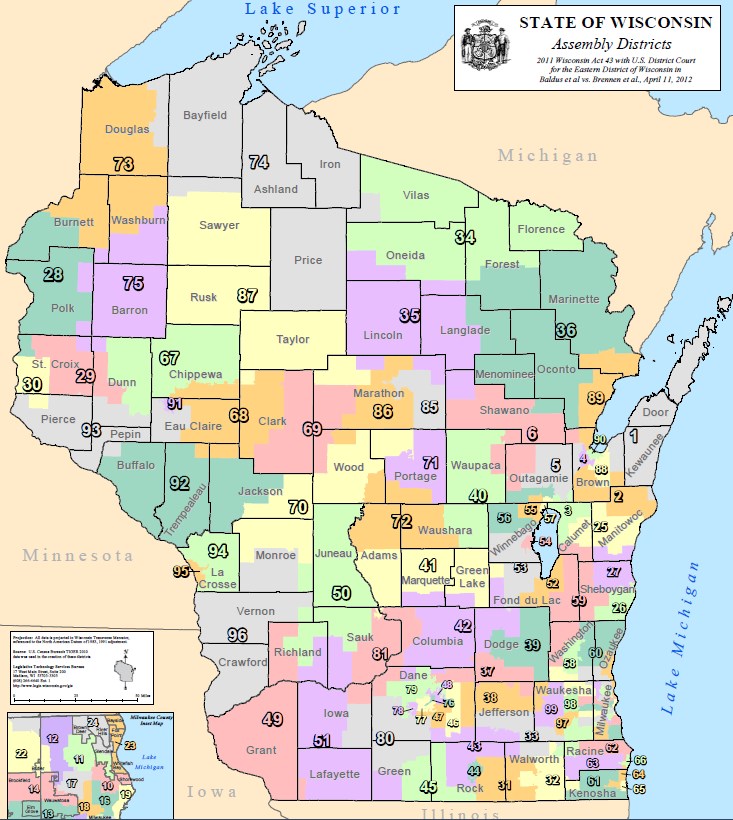
In the state Assembly, which has 99 legislative districts, Republicans represent 29 of the 30 districts with the largest proportion of whites, ranging from about 93 percent to 96 percent. Meanwhile, Democrats were elected in 21 of the 30 assembly districts with the smallest proportion of white residents, ranging from about 15 percent to 84.6 percent. (See Tables 3 & 4).
According to the 2010 Census, “Wisconsin’s population is about 83% white, 6% black, 6% Hispanic, 2% Asian, and 1% American Indian. Individuals of other and multiple races make up less than 2% of Wisconsin’s population.”
Wisconsin’s minority populations are largely concentrated in the state’s only major urban area – Milwaukee.
As a result, 27 of the 33 Senate districts have populations that are more than 80 percent white, and 13 of those districts are more than 90 percent white.
In the Assembly, 81 of the 99 districts are more than 80 percent white, and 52 of the 99 districts are more than 90 percent white.
Table 1: Senate Districts With Largest White Population
| Legislator | Senate District | Party | % White | % Non-White |
|---|---|---|---|---|
| Howard Marklein | 17 | R | 94.9 | 5.1 |
| Terry Moulton | 23 | R | 94.4 | 5.6 |
| Sheila Harsdorf* | 10 | R | 94.2 | 5.8 |
| Duey Stroebel | 20 | R | 94 | 6 |
| Frank Lasee* | 1 | R | 93.4 | 6.6 |
| Luther Olsen | 14 | R | 93.3 | 6.7 |
| Tom Tiffany | 12 | R | 92.8 | 7.2 |
| Scott Fitzgerald | 13 | R | 92.8 | 7.2 |
| Kathleen Vinehout | 31 | D | 92.6 | 7.4 |
| Patrick Testin | 24 | R | 92.5 | 7.5 |
| Jennifer Shilling | 32 | D | 92.5 | 7.5 |
*Recently resigned
Table 2: Senate Districts With Smallest White Population
| Legislator | Senate District | Party | % White | % Non-White |
|---|---|---|---|---|
| LaTonya Johnson | 6 | D | 23.4 | 76.6 |
| Lena Taylor | 4 | D | 27.6 | 72.4 |
| Tim Carpenter | 3 | D | 40.2 | 59.8 |
| Robert Wirch | 22 | D | 62.7 | 37.3 |
| Fred Risser | 26 | D | 76.2 | 23.8 |
| Mark Miller | 16 | D | 78.4 | 21.6 |
| Chris Larson | 7 | D | 82 | 18 |
| Dave Hansen | 30 | D | 82.5 | 17.5 |
| Roger Roth | 19 | R | 83 | 17 |
| Janis Ringhand | 15 | D | 85.8 | 14.2 |
Table 3: Assembly Districts With Largest White Population
| Legislator | Assembly District | Party | % White | % Non-White |
|---|---|---|---|---|
| Travis Tranel | 49 | R | 96 | 4 |
| Rob Swearingen | 34 | R | 95.7 | 4.3 |
| Rob Summerfield | 67 | R | 95.7 | 4.3 |
| Lee Nerison | 96 | R | 95.7 | 4.3 |
| Joel Kitchens | 1 | R | 95.4 | 4.6 |
| Todd Novak | 51 | R | 95.4 | 4.6 |
| Warren Petryk | 93 | R | 95.4 | 4.6 |
| Mary Felzkowski | 35 | R | 95.1 | 4.9 |
| John Nygren | 89 | R | 95 | 5 |
| Bob Gannon* | 58 | R | 94.6 | 5.4 |
| Romaine Quinn | 75 | R | 94.6 | 5.4 |
| Adam Jarchow | 28 | R | 94.5 | 5.5 |
| Kevin Petersen | 40 | R | 94.5 | 5.5 |
| John Spiros | 86 | R | 94.5 | 5.5 |
| Rob Stafsholt | 29 | R | 94.3 | 5.7 |
| Sondy Pope | 80 | D | 94.3 | 5.7 |
| Keith Ripp** | 42 | R | 94 | 6 |
| Robert Brooks | 60 | R | 94 | 6 |
| Chuck Wichgers | 83 | R | 94 | 6 |
| Shannon Zimmerman | 30 | R | 93.9 | 6.1 |
| Bob Kulp | 69 | R | 93.9 | 6.1 |
| Cindi Duchow | 99 | R | 93.8 | 6.2 |
| Kathy Bernier | 68 | R | 93.7 | 6.3 |
| Jesse Kremer | 59 | R | 93.5 | 6.5 |
| Nancy VanderMeer | 70 | R | 93.3 | 6.7 |
| Ed Brooks | 50 | R | 93.2 | 6.8 |
| John Jagler | 37 | R | 92.9 | 7.1 |
| Joel Kleefisch | 38 | R | 92.9 | 7.1 |
| Mark Born | 39 | R | 92.8 | 7.2 |
| Andre Jacque | 2 | R | 92.7 | 7.3 |
*Recently passed away. **Recently resigned.
Table 4: Assembly Districts With Smallest White Population
| Legislator | District | Party | % White | % Non-White |
|---|---|---|---|---|
| JoCasta Zamarripa | 8 | D | 15.2 | 84.8 |
| Leon Young | 16 | D | 22.2 | 77.8 |
| Jason Fields | 11 | D | 22.6 | 77.4 |
| Evan Goyke | 18 | D | 23.4 | 76.6 |
| David Crowley | 17 | D | 24.6 | 75.4 |
| David Bowen | 10 | D | 27.6 | 72.4 |
| Fred Kessler | 12 | D | 32.4 | 67.6 |
| Josh Zepnick | 9 | D | 33.4 | 66.6 |
| Cory Mason* | 66 | D | 47.8 | 52.2 |
| Tod Ohnstad | 65 | D | 65.2 | 34.8 |
| Daniel Riemer | 7 | D | 70.3 | 29.7 |
| Jimmy Anderson | 47 | D | 70.8 | 29.2 |
| Terese Berceau | 77 | D | 71.9 | 28.1 |
| Lisa Subeck | 78 | D | 75 | 25 |
| Peter Barca | 64 | D | 75.2 | 24.8 |
| Melissa Sargent | 48 | D | 75.9 | 24.1 |
| Mark Spreitzer | 45 | D | 78.3 | 21.7 |
| Christine Sinicki | 20 | D | 78.9 | 21.1 |
| Chris Taylor | 76 | D | 81.7 | 18.3 |
| Dan Knodl | 24 | R | 82.1 | 17.9 |
| Jonathan Brostoff | 19 | D | 82.3 | 17.7 |
| Ken Skowronski | 82 | R | 82.4 | 17.6 |
| Scott Allen | 97 | R | 82.7 | 17.3 |
| Jeremy Thiesfeldt | 52 | R | 83 | 17 |
| Eric Genrich | 90 | D | 83 | 17 |
| Thomas Weatherston | 62 | R | 83.2 | 16.8 |
| John Macco | 88 | R | 83.7 | 16.3 |
| Patrick Snyder | 85 | R | 83.8 | 16.2 |
| Terry Katsma | 26 | R | 84.1 | 15.9 |
| Tyler August | 32 | R | 84.6 | 15.4 |
*Recently resigned.
Political Contributions Tracker
Displaying political contributions between people mentioned in this story. Learn more.
- February 3, 2020 - Jason Fields received $50 from Tod Ohnstad
- December 13, 2019 - JoCasta Zamarripa received $250 from Lisa Subeck
- June 5, 2019 - JoCasta Zamarripa received $100 from Lisa Subeck
- June 3, 2019 - JoCasta Zamarripa received $100 from Christine Sinicki
- April 24, 2019 - JoCasta Zamarripa received $30 from Josh Zepnick
- June 16, 2016 - David Crowley received $200 from Fred Kessler
- April 8, 2016 - David Crowley received $150 from Mark Spreitzer
- December 17, 2015 - David Crowley received $100 from David Bowen
- September 24, 2015 - David Crowley received $100 from Melissa Agard
- April 1, 2015 - Josh Zepnick received $50 from Evan Goyke
- March 30, 2015 - Josh Zepnick received $50 from Tim Carpenter
- March 30, 2015 - Josh Zepnick received $100 from JoCasta Zamarripa


They look green, pink, yellow, to me and from air they are green. all the dumb Lefties live in madison/milwaukee area, the worst run cities in state, and schools.
But WCD, “Socialist” Madison and Dane County are the only areas of Wisconsin that actually have a thriving economy!!
2/3rds of the jobs created in Wisconsin since career politician Scott Walker has been in power have been in the Madison area! Hhhmmm, why is that? Madison is holding up the rest of the mooching republicans in the state!
Idiots like Sean Duffy and other republicans constantly complain of “communists” in Madison yet their districts up north are wastelands of poverty, unemployment, alcoholism and hopelessness and yet in progressive Madison people and the econony are thriving! Career politician Scott Walker constantly trashes the good hard working people of Madison but without all these evil “socialists” and their good jobs and work ethic the state would be even worse off than it is already under Walker!
Oh yeah, WCD, cannabis has been decriminalized in Madison since 1977. Sorry, you should put down the booze and pills. You can’t change reality nor turn back the clock you bitter old man.
DUMP WALKER 2018!!
DUMP ALL REPUBLICANS 2018!!