
How Gerrymandered Is New State Map?
Let’s measure how the two parties will fare under maps approved by state Supreme Court.
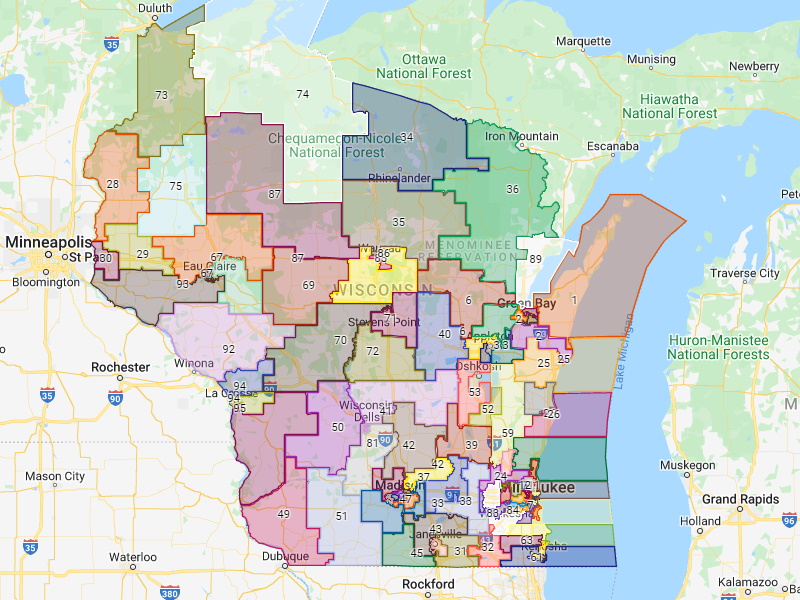
Gov. Evers’ “least changes” Assembly map.
On November 30th of last year, the Wisconsin Supreme Court issued the first of two decisions concerning the redistricting of Wisconsin’s state Senate and Assembly seats, as well as the state’s Congressional delegation. A four-vote majority of the justices asked interested parties to submit their proposed maps and announced that the winning map would be the one that made the least changes to the existing map adopted after the 2010 U.S. Census.
In other words, the highly partisan Republican gerrymander, adopted in secrecy by the Republican legislative majority and signed by Republican Governor Scott Walker, would continue largely unchanged for the next ten years. Only the changes needed to accommodate population shifts would be allowed. Notably, the decision did not attempt to define “least change” or how it should be measured.
Three justices dissented. Written by Justice Rebecca F. Dallet and joined by Justices Ann Walsh Bradley and Jill Karofsky, the dissent accused the majority of dealing “a striking blow to representative government in Wisconsin by ignoring those neutral principles and committing the court to an approach that prioritizes an obsolete partisan agenda.” In other words, the court majority whiffed when given the opportunity to uphold democracy.Following this decision, six parties submitted proposed district maps. Among the parties were Governor Tony Evers, Republican legislators, and members of Congress.
An analysis by Marquette Law’s John Johnson of the proposals included several measures going to the “least change” issue.
One was the question of how much of the population would move to another district. On this measure the governor’s map had the least change for the Assembly and Congress and tied with the legislators’ map for the state Senate. (Note that the label on Johnson’s chart is inverted. The chart shows the fraction that would move, not the portion placed in the same district.)
Another measure was the number of new districts that mainly overlapped with the old districts. Johnson finds that in the Republicans’ map, 98 of the 99 Assembly districts mostly overlapped their predecessor, while 97 do so in the Governor’s map.
On March third of this year, the Wisconsin Supreme Court issued its second decision. Like the previous decision. the vote was also 4-3, but only Justice Brian Hagedorn was on the winning side in both. In fact, Hagedorn wrote the majority decision, which chose Evers’ map because it had the lowest number of people being shifted from one district to another.
Ignoring the principle that “less is more,” the three dissenting justices—Annette Ziegler, Patience Roggensack, and Rebecca Bradley filed dissenting opinions, each of which was endorsed by the other dissenting judges. These dissents took up 120 pages, compared to 28 for Hagedorn’s majority opinion.As Bruce Murphy noted, the tone of these dissents is surprisingly harsh, accusing the majority of demonstrating “a complete lack of regard for the Wisconsin Constitution and the Equal Protection Clause.” Ziegler describes the opinion as “short on legal analysis and long on ipse dixit,” which a dictionary defines as “a dogmatic and unproven statement.”
Where does this leave us? Assuming promised appeals are unsuccessful, a Legislature that looks like Wisconsin for the next decade is unlikely. Shown below are the number of Assembly seats that each party can expect to win if each party wins half the votes in Wisconsin.
Based on the 2020 presidential election, the column of the left predicts that with a tied vote, Democrats would win 37 seats and Republicans 62 under the 2010 gerrymander. The column of the right shows that with the court’s decision, there is likely to be a shift of two seats, to 39 for Democrats and 60 for Republicans.
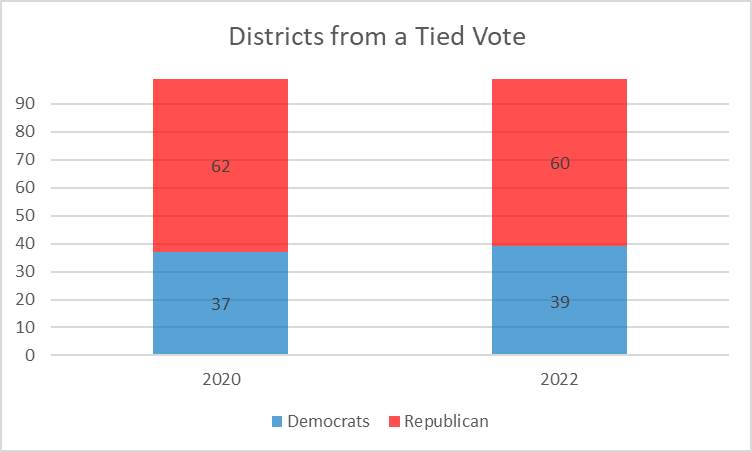
Districts from a Tied Vote
The next chart shows my estimate of the vote needed for Democrats to win half the Assembly districts. Under the maps passed by the court, the percentage of seats needed drops from the earlier 55.5% to 53.3%.
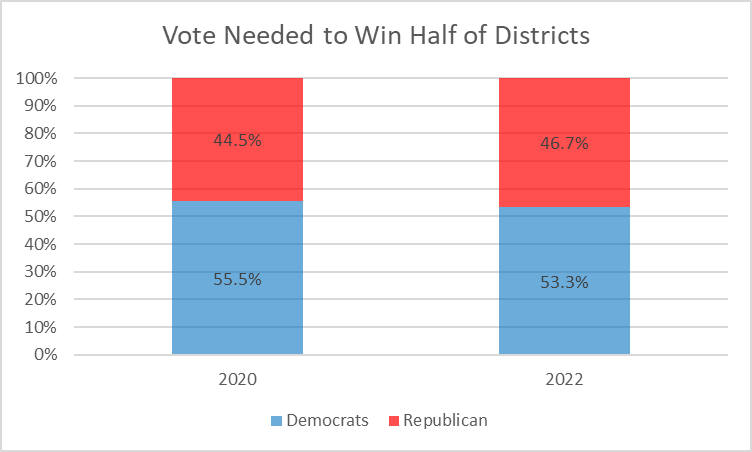
Votes Needed to Win Half of Districts
The chart below shows the predicted number of districts won by Democrats (in blue) and Republicans (in red) assuming a range of statewide votes ranging between 40% and 60%. The horizontal axis shows the votes won; the vertical axis shows the number of seats won.
The solid lines show the numbers of seats won by each party under the map adopted by the court. The dashed lines show the result under the 2010 gerrymander.
For comparison I added the likely seats that would have been won by each party if the court had adopted the plan for the Assembly recommended by Governor Evers’ People’s Map Commission. This third scenario is shown using dotted lines. Although this third map would not entirely eliminate the gap between the ability of Democrats and Republicans to convert votes into seats, it would have substantially reduced that gap. Compared to the plan adopted by the court, the gap would drop from 21 to 9 seats.
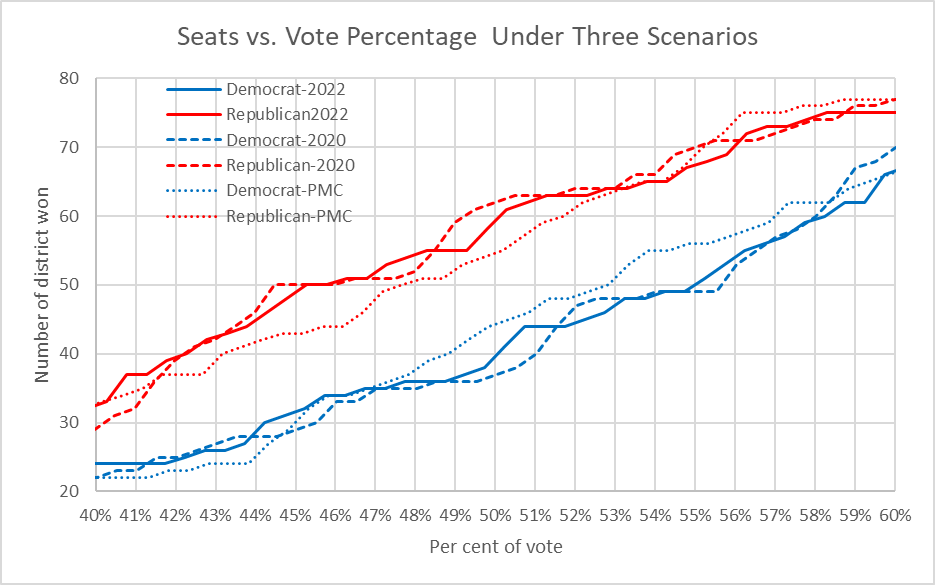
Seats vs. Vote Percentage Under Three Scenarios
In the Rucho case challenging partisan gerrymanders, U.S. Chief Justice John Roberts declared that gerrymandering was too complex for the courts to deal with. Perhaps he was frightened by the huge number of models that have been developed to measure gerrymandering. Yet these models are consistent. If one model shows gerrymandering so will others.
Consider the three maps shown in the previous graph. The chart below shows the result when three different models of fairness are applied to them. Each gives the same message: the 2010 redistricting (in yellow) was slightly more gerrymandered than the map adopted by the court (in green), which, in turn, is more gerrymandered than the People’s Map Commission map (in purple).

Three measures of fairness
Gerrymandering is a threat to democracy, allowing those in power to thwart the will of the voters and entrench themselves in office. Clearly there remains a big gap between autocracy in, say, Russia and that in Wisconsin, but we are moving in the wrong direction, with another decade of very unrepresentative legislative seats.
Gerrymandering also contributes to extremism by creating so-called “safe seats,” where one party dominates. In such a case, an incumbent is likely to worry much more about the party primary rather than the general election.
More about the Gerrymandering of Legislative Districts
- Without Gerrymander, Democrats Flip 14 Legislative Seats - Jack Kelly, Hallie Claflin and Matthew DeFour - Nov 8th, 2024
- Op Ed: Democrats Optimistic About New Voting Maps - Ruth Conniff - Feb 27th, 2024
- The State of Politics: Parties Seek New Candidates in New Districts - Steven Walters - Feb 26th, 2024
- Rep. Myers Issues Statement Regarding Fair Legislative Maps - State Rep. LaKeshia Myers - Feb 19th, 2024
- Statement on Legislative Maps Being Signed into Law - Wisconsin Assembly Speaker Robin Vos - Feb 19th, 2024
- Pocan Reacts to Newly Signed Wisconsin Legislative Maps - U.S. Rep. Mark Pocan - Feb 19th, 2024
- Evers Signs Legislative Maps Into Law, Ending Court Fight - Rich Kremer - Feb 19th, 2024
- Senator Hesselbein Statement: After More than a Decade of Political Gerrymanders, Fair Maps are Signed into Law in Wisconsin - State Senate Democratic Leader Dianne Hesselbein - Feb 19th, 2024
- Wisconsin Democrats on Enactment of New Legislative Maps - Democratic Party of Wisconsin - Feb 19th, 2024
- Governor Evers Signs New Legislative Maps to Replace Unconstitutional GOP Maps - A Better Wisconsin Together - Feb 19th, 2024
Read more about Gerrymandering of Legislative Districts here
Data Wonk
-
Who Do You Trust to Conduct Elections Fairly?
 Apr 6th, 2026 by Bruce Thompson
-
Is Non-Citizen Voting a Real Threat to Elections in Wisconsin?
Mar 18th, 2026 by Bruce Thompson
-
How Global Climate Change Affects Milwaukee
 Mar 11th, 2026 by Bruce Thompson


When State Supreme Court candidates are funded by the WMC, the Association of Commerce and the Hendricks-Menard-Uehlein conglomerate, we can depend on generally predetermined elective outcomes. So here’s to another decade of disfunction thanks to our very own Wisconsin Oligarchs and their flunkies. Slainte!