
Pandemic Politics Threatens Lives And Economy
The data for Wisconsin is worrisome. The politics is puzzling.
2019 Novel Coronavirus. Image by the Centers for Disease Control and Prevention.
The figure below plots the average number of COVID-19 cases (in blue) and deaths (in red) per day since the pandemic first hit Wisconsin. To reduce some of the data’s noisiness, all values were calculated by averaging the data over seven days.
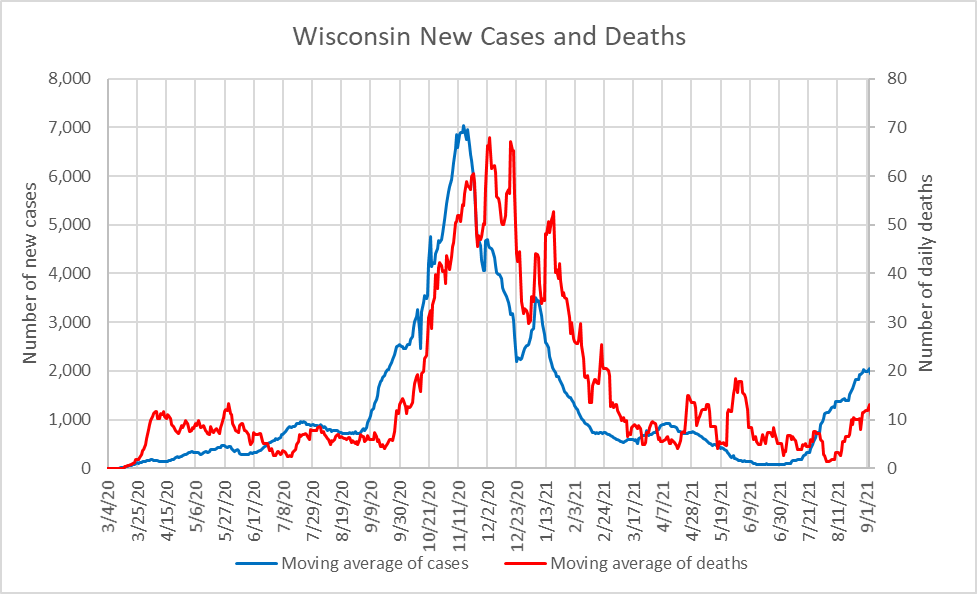
Wisconsin New Cases and Deaths
Wisconsin cases peaked at 7,000 per day in mid-November of last year, exceeded only by North and South Dakota. About two weeks later, in early December, the number of deaths peaked at almost 70 per day.
The data consistently show that about 1% of the people diagnosed with COVID-19 succumb to it, typically two to three weeks after the diagnosis.
Following the November peak, cases began a fairly steady decline in Wisconsin. By last June, it appeared the pandemic was at last loosening its deadly grip on Wisconsin. For much of the month, daily cases were in the 80s and deaths were in the single digits.Factors behind this decline likely reflected more social distancing, the wearing of masks, and the availability of vaccines for anyone of wanted one. Unfortunately, this good news was not to last. In early July, cases started to rise, followed by increased deaths. Judged by the numbers, the case load at the beginning of September this year has already reached the level of the end of September last year.
The next graph plots the daily growth rate of cases over the months of July and August 2021, defined as the ratio of cases in one day to that of the previous day. Values over one show increasing cases; those below one show a decline in the number of new cases.
The good news is that average daily growth in August 2021–1.024 or 2.4%–was lower than the July 2021 average–1.088 or 8.8%. The bad news is that growth was still positive, in part reflecting the spread of the much more transferable Delta virus.
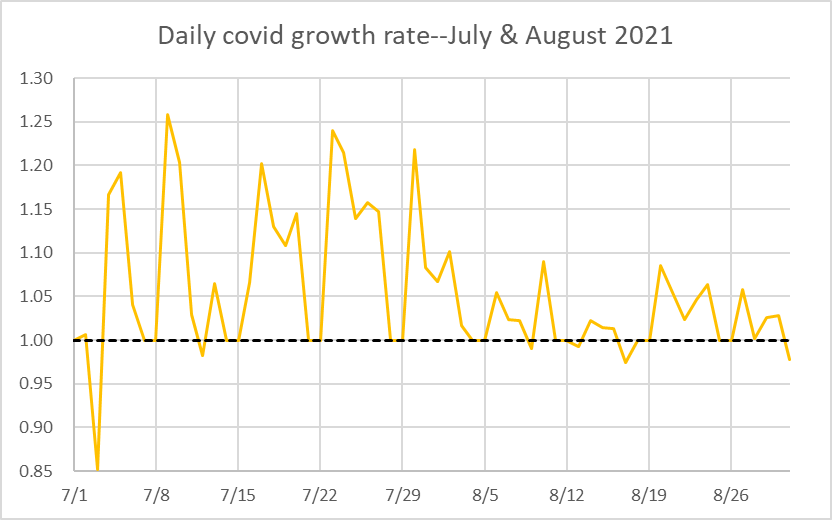
Daily covid growth rate–July & August 2021
The next graph shows the number of Wisconsin cases in July and August of 2021. The blue line shows the actual number of cases. The red line shows the predicted number of cases using the average August growth.
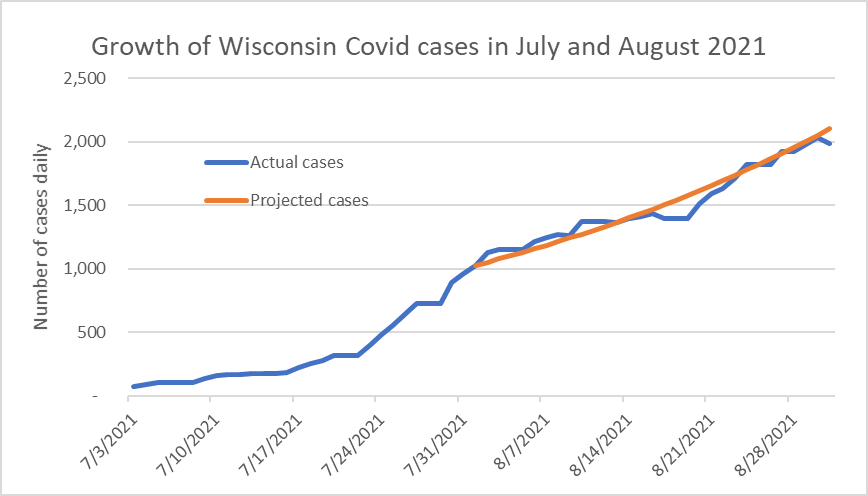
Growth of Wisconsin Covid cases in July and August 2021
If allowed to continue through the end of the year, the number of cases would grow from the current 2,000 to 38,000!
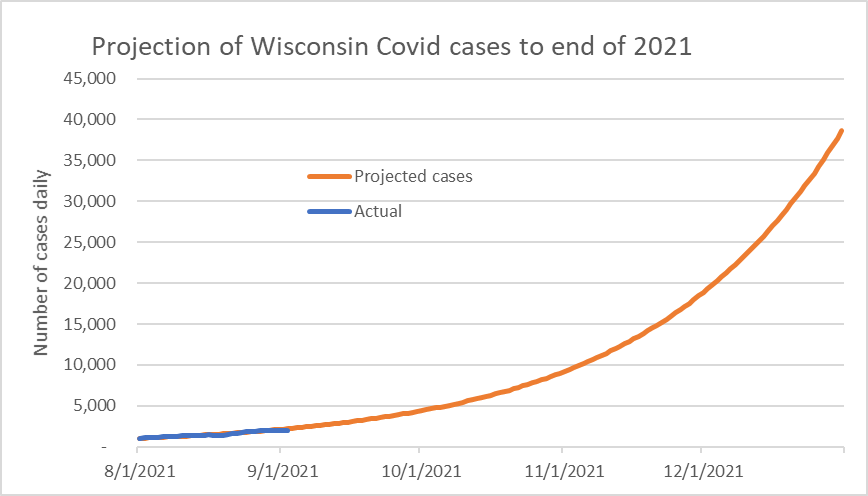
Projection of Wisconsin Covid cases to end of 2021
Like other northern states, Wisconsin is particularly vulnerable to the upcoming change in weather. As the temperature goes down, moving activities outdoors becomes much less feasible. Thus, Wisconsin may be facing a choice between mitigating the virus and shutting down the state’s economy.
We may be seeing the early stages of this shutdown. The next chart shows the monthly change in US jobs through August. The substantial decrease in August jobs added compared to July has been met with widespread disappointment

Changes in US jobs
It turns out that much of the weakness was concentrated in a few categories that are particularly vulnerable to the resurgence of COVID-19. This includes eating and drinking establishments, restaurants and bars. As the next chart shows, July hiring by these businesses was down compared to June.
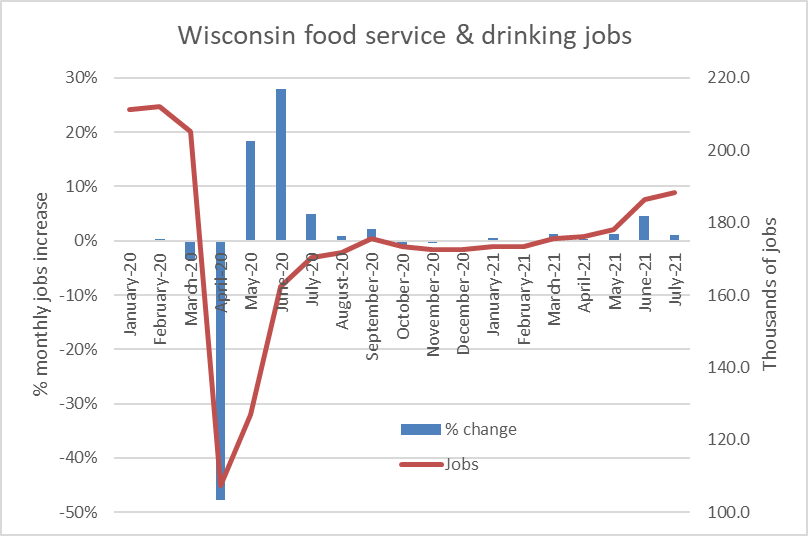
Wisconsin food service & drinking jobs
State jobs data are not yet available for August. However, the US figures suggest what to expect. Rather than growing, jobs in restaurants and taverns showed a small decline.
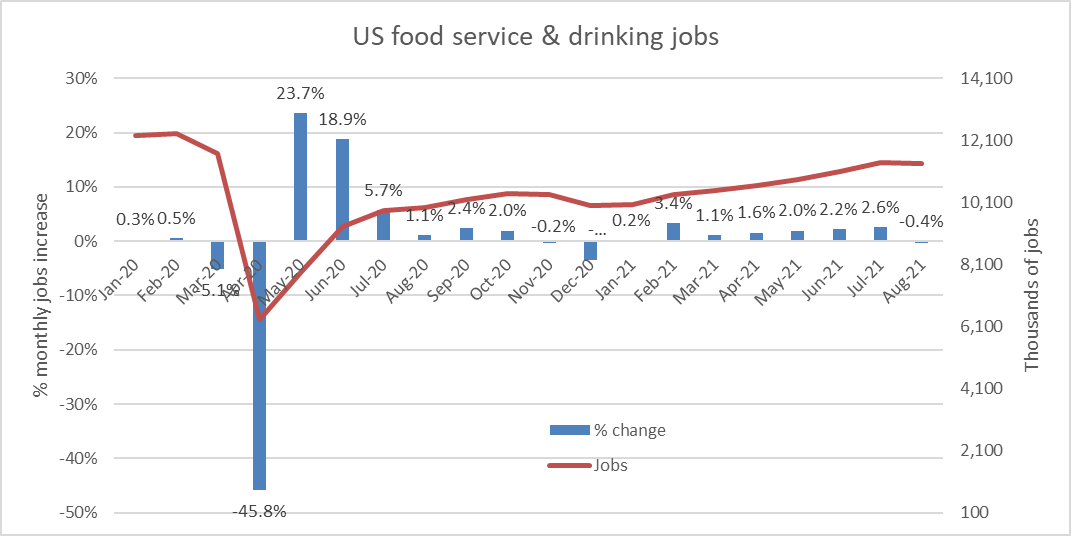
US food service & drinking jobs
The spread of the virus in Wisconsin is bad for both the health and life expectancy of Wisconsin people of all ages. It is also bad for business.
It is surprising and disappointing that Wisconsin’s Legislature and political pressure groups, like those in other states, are afflicted by a pro-covid caucus that opposes any measures to reduce the impact of the disease. This includes opposition to wearing masks and the spreading of lies aimed at discouraging vaccinations. We have reached a remarkable point in America, where promoting sickness and death is considered winning in politics. Unless that changes, the data will continue to get worse.
More about the Coronavirus Pandemic
- Governors Tony Evers, JB Pritzker, Tim Walz, and Gretchen Whitmer Issue a Joint Statement Concerning Reports that Donald Trump Gave Russian Dictator Putin American COVID-19 Supplies - Gov. Tony Evers - Oct 11th, 2024
- MHD Release: Milwaukee Health Department Launches COVID-19 Wastewater Testing Dashboard - City of Milwaukee Health Department - Jan 23rd, 2024
- Milwaukee County Announces New Policies Related to COVID-19 Pandemic - David Crowley - May 9th, 2023
- DHS Details End of Emergency COVID-19 Response - Wisconsin Department of Health Services - Apr 26th, 2023
- Milwaukee Health Department Announces Upcoming Changes to COVID-19 Services - City of Milwaukee Health Department - Mar 17th, 2023
- Fitzgerald Applauds Passage of COVID-19 Origin Act - U.S. Rep. Scott Fitzgerald - Mar 10th, 2023
- DHS Expands Free COVID-19 Testing Program - Wisconsin Department of Health Services - Feb 10th, 2023
- MKE County: COVID-19 Hospitalizations Rising - Graham Kilmer - Jan 16th, 2023
- Not Enough Getting Bivalent Booster Shots, State Health Officials Warn - Gaby Vinick - Dec 26th, 2022
- Nearly All Wisconsinites Age 6 Months and Older Now Eligible for Updated COVID-19 Vaccine - Wisconsin Department of Health Services - Dec 15th, 2022
Read more about Coronavirus Pandemic here
Data Wonk
-
Who Do You Trust to Conduct Elections Fairly?
 Apr 6th, 2026 by Bruce Thompson
-
Is Non-Citizen Voting a Real Threat to Elections in Wisconsin?
Mar 18th, 2026 by Bruce Thompson
-
How Global Climate Change Affects Milwaukee
 Mar 11th, 2026 by Bruce Thompson


Your last paragraph sums it up perfectly. The GOP wants things to get worse and to have our recovery blunted by COVID, so they can blame Biden/Evers for not fixing everything. They only care about power, and using that power to grab more money and more power. They don’t care how much wreckage happens to typical Wisconsinites as a result.
Of course, a problem is that the increase over the last 3-4 weeks has been driven largely by anti-vax, pro-Trump counties in rural Wisconsin (Forest, Taylor and Oconto especially). Which makes it harder to win when your already-bad demographics have an increase in death associated with them.