
Wisconsin Budget
Best Funded Schools Have Best Achievement
Students in state’s wealthiest school districts are 4 grade levels above poorest districts.
Get a daily rundown of the top stories on Urban Milwaukee
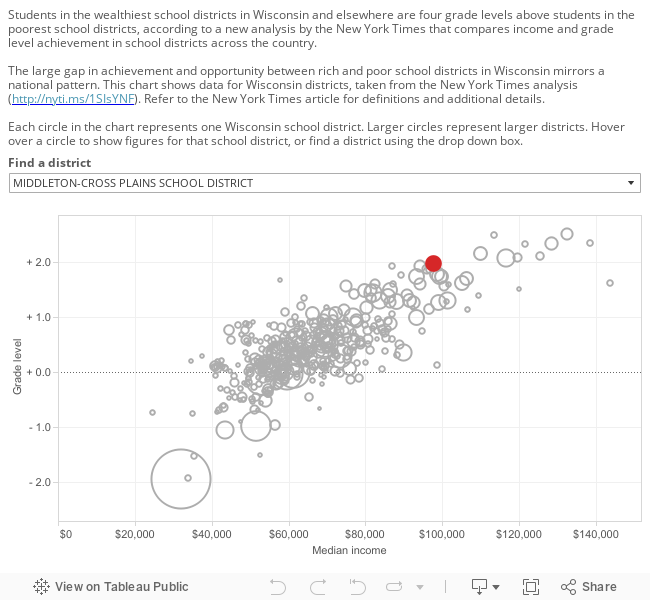
Data from Sean F. Reardon, Demetra Kalogrides, Andrew Ho, Ben Shear, Kenneth Shores, Erin Fahle. (2016). Stanford Education Data Archive.
Wisconsin Budget
-
Charting The Racial Disparities In State’s Prisons
 Nov 28th, 2021 by Tamarine Cornelius
-
State’s $1 Billion Tax Cut Leaves Out 49% of Taxpayers
 Sep 21st, 2021 by Tamarine Cornelius
-
TANF Program Serves a Fraction of Poor Families
 Aug 30th, 2021 by Jon Peacock


I think the title of this article is misleading in comparison to the data that it presents. This data shows, (as most studies do) that students from wealthier communities do better, not necessarily better funded schools. The root cause of under-performing students is families that lack the capital to assist their children with academics.
Really flies in the face of those ridiculous US News rankings putting King and Reagan (and to a lesser extent Riverside and Arts) near the top in the state.
Ryan, You’re right, the title completely misrepresents the content of the article.
Ryan: Yes the article correlates income to performance, but since school funding in Wisconsin is tied to local property taxes higher income generally indicates better funded schools. However this still does not necessarily prove anything as correlation does not equal causation. I think we can all agree that families play a large role in academic success but I think it would be folly to suggest that funding of a school has nothing to do with it.
Kurt: I was a teacher at multiple schools within MPS including King and have been a teacher elsewhere so I can testify to the fact that King is actually an amazing school deserving of its ranking. The problem is that many other schools in MPS are doing so poorly that it drags the overall district average down in the graphic included in this article.
Heron,
I’d bet you a dollar that the per pupil spending gap that you suggest is no where near the income gap of these districts. It may even be inverted. Obviously correlation does not equal causation, but a whole lot of correlation does start to add up to causation eventually.
I’m a parent of kids at MPS, and there are some good schools in it. But the notion that they are some of the best in the state is laughable. I mean I’m sure you can play with some numbers or use specific metrics to get those results (as publication like US News obviously does).
And, just for the sake of argument, let’s say they really are such top schools. What does that say about a district as large as MPS being able to barely cobble together 1 or 2 good high schools?
I believe Kurt’s uninformed commentary come from a failure to understand the concept of a distribution.
In a given grouping of persons or collections thereof, individual performance in any number of given traits varies wildly. In many cases, these plotted performances resemble a “bell curve” (a normal distribution), with most of the constituent members falling toward the middle. There are, however, members whose performances will skew toward the high or low end of the spectrum. The larger the group, the closer the plot resembles a perfect normal curve.
The classic example is IQ. The mean IQ is 100, and supposedly if we plotted the whole world’s IQ scores, we would observe a pretty flawless bell shape, with Stephen Hawking toward the right (high) end of the graph and reality TV stars toward the left (low) end.
Now, where it gets interesting is when you examine the normal curves of different populations. We still have the same shape, but critical values like the mean and spread will vary. For example, if you compare the IQ scores of Poland (mean IQ 106) to that of Ghana (mean IQ is 76), you might argue that Poland is smarter than Ghana. On average, this may be true, but if Rick Rosner relocated to Ghana, Ghana would have a mean IQ of 76 and still have at least one person smarter than anyone in Poland (though Rosner may be considered an outlier, the point still holds).
This is true with MPS too. Average school might stink, but in terms of academic performance an MPS school or two is certainly capable of outdoing every other. Especially true considering the size of MPS compared to other school districts.
Dude,
Thanks for the uninformed nod (I did alright in stats). I’m actually speaking exactly to the bell curve notion.
First, I was comparing MPS schools to statewide rankings. Therefore the distribution you mentioned is not specific to MPS, but schools statewide. So to use your bell curve, you’re implying that when laying the MPS bell curve over other districts’ bell curve, you’d see the leading edge of that curve for MPS lining up roughly with the other best districts. The problem is the gooey middle would be much further left, and closer to the trailing edge of the curve.
Second, when I made my comment about MPS producing only 1 or 2 good high schools, I’m not speaking to the “mean” of schools in MPS. Again, I’m glad you brought up the bell curve. I’m speaking to the actual distribution of MPS schools not resembling a true bell curve, but more of curve with a very low, flat leading edge, and the rest smooshed to the left.
I will apologize for derailing this comment string in the first place. I probably should not have brought up the US News (and similar) rankings. I stand by my points as a parent immersed in teenagers from both in and out of MPS, and both the best and lesser MPS schools, and what I’ve witnessed in terms of educational quality, diversity, complexity, and opportunities.
Anyway, defending your point with statistical theory is all conjecture. Actual results will always vary. And that statement is as valid as dismissing my points with what “should” be.
lol, I am 100% sure that MPS’s constituent schools’ performances follow a normal distribution (plot it in Excel). The mean is simply lower than other districts. There is no way it can be “smooshed” because there is no left “end” (at least anywhere near our relevant data). See the data from the DPI School Report Card system: https://apps2.dpi.wi.gov/sdpr/spr.action
There are extreme differences in scale when overlaying the MPS curve with that of other districts. MPS’s right-hand tail may indeed come close to or surpass the right-hand tails of the best districts, mostly because the MPS curve would tower over the others. Big curve vs. smaller curve.
As far as your question “what does that say about a district as large as MPS being able to barely cobble together 1 or 2 good high schools” . . . well, there are a number of decent-to-good high schools, but only one or two of the best in the state because . . . there can only be one or two best in the state.
To be honest, though, I think the comment “that [MPS schools] are some of the best in the state is laughable” is the one that seemed mislead. The entire point in bringing up statistical theory was to show how this is quite possible. Regardless of belief in possibility, a report did come out stating that MPS has a few of the best schools in Wisconsin. Argue with the report if you’d like (and you may have some valid points in doing that), but it’s difficult to handwave away the mere notion, despite anecdotal experience.
I understand that it seems odd, and I have been condescending, so for that I’m sorry. It is true that MPS as a whole is under-performing. But we must give credit to those schools that are working, and based on everything from high college admission rates to stellar ACT scores to low incidences of violence and drug use, there are some very good MPS schools.
What I am curious about is what is the Brenton School District and/or parents doing right? Median income $57k but is 1.7 grade above level. Great return on the investment in education.
Dudemeister, there’s one big issue I have with your discussion points. The measurements in the story above are related to actual student grade level performance while the “best schools” ratings you are referring to are measuring school performance in educating students when controlling for factors like income, minority status, etc. Those top high schools in the state you keep referring to are very average when comparing actual performance metrics.