
Is COVID-19 Transforming Itself?
Far fewer deaths per cases of omicron in Wisconsin and nation. Will anti-vaxxers exploit this?
2019 Novel Coronavirus. Image by the Centers for Disease Control and Prevention.
During much of the pandemic, the COVID-19 virus followed a consistent pattern of infection. A peak in daily cases would be followed a few weeks later by a peak in deaths. The number of daily cases would then drop, as mitigation efforts, including isolation and masking, were stepped up. A few weeks later, the case decline was followed by a drop in covid deaths.
This pattern is reflected in the graph below. In it, the blue line shows the number of new cases every day using the scale on the left. The orange line shows the number of daily deaths attributed to covid, using the scale on the right. Typically, 1% to 2% of the people diagnosed with covid would subsequently die of it.One exception to this pattern was the initial peak in covid deaths during the spring of 2020. Around 7% of those diagnosed with covid would die from it. As the graph below shows, this spike in deaths came in response to a spike in cases that barely registers on the charts today. Likely causes include extreme undercounting of covid cases and uncertainty as to how best to treat covid patients.
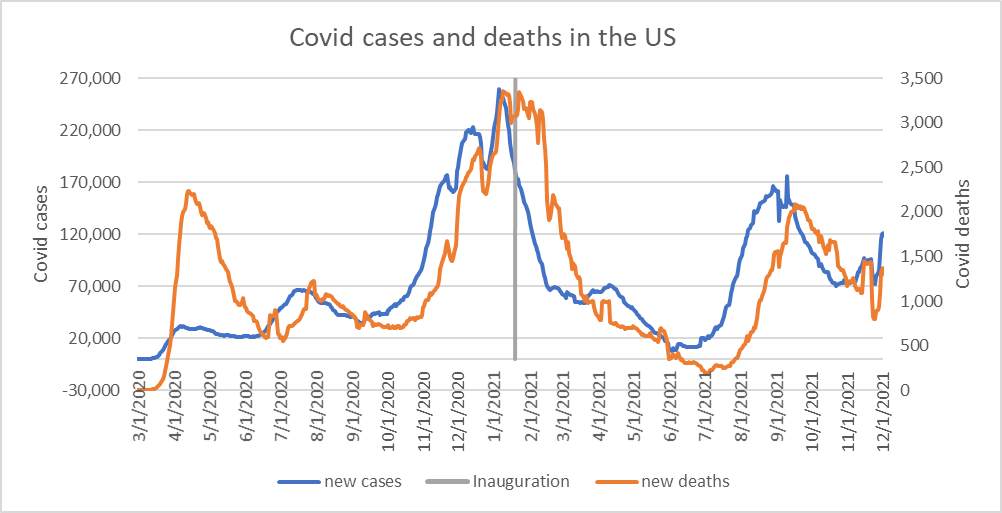
Covid cases and deaths in the U.S.
Towards the end of 2021, reports originated from South Africa of a new covid variant, called omicron. Early reports were that it was much more infectious than previous variants. Subsequent reports indicated it was less lethal than earlier variants of covid.
The next graph extends the timeline of the above graph to mid-February 2022. The advent of the omicron variant has led to a spike in cases far bigger than anything seen previously. In fact, to show it, I had to expand the case scale from a maximum of 270,000 to 800,000. Yet, despite this spike in cases, the spike in covid deaths is less than that seen a year ago.
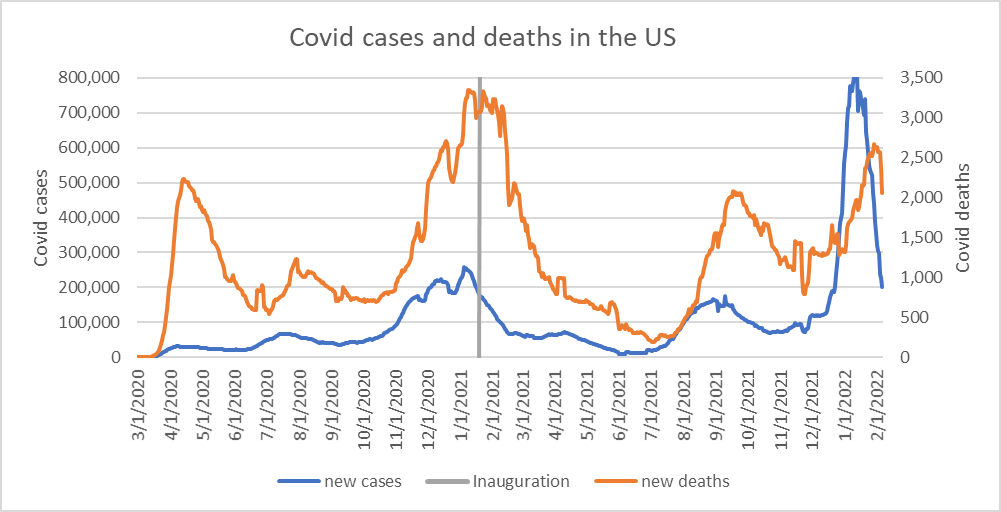
Covid cases and deaths in the U.S.
Over the previous two years, peak deaths as a function of peak cases has consistently declined, as shown in the graph below. The good news is that the fraction of people whose covid leads to death has been declining. The bad news is that the omicron variant offsets its lower lethality by being far more infectious.
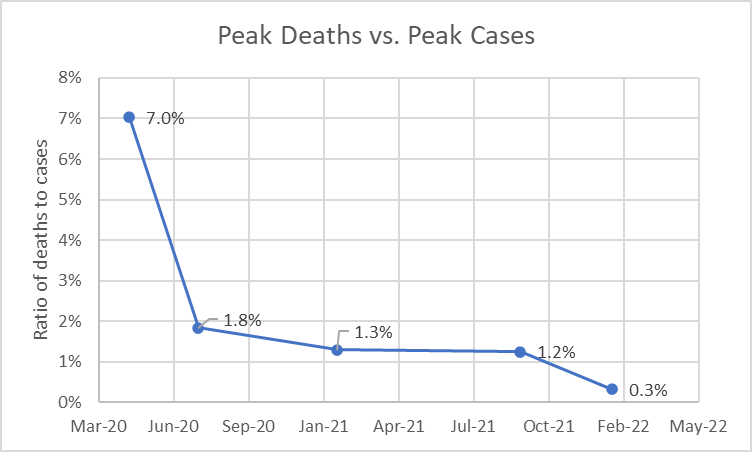
Peak Deaths vs Peak Cases
The next chart compares the actual deaths from covid (shown with a solid red line) with a regression model (shown with the dashed red line). The model was developed using case and death data for 2020 and 2021. It predicts the number of deaths based on a single variable: the number of cases 28 days earlier.
As the chart shows, the resulting model fits the actual data very well, except for far underpredicting the number of deaths in our initial encounter with the virus. This is confirmed by a coefficient of determination equal to 94% (meaning the model explains 94% of the variation in the data).
Starting toward the end of last year, however, the ability of the model to predict deaths disappears.
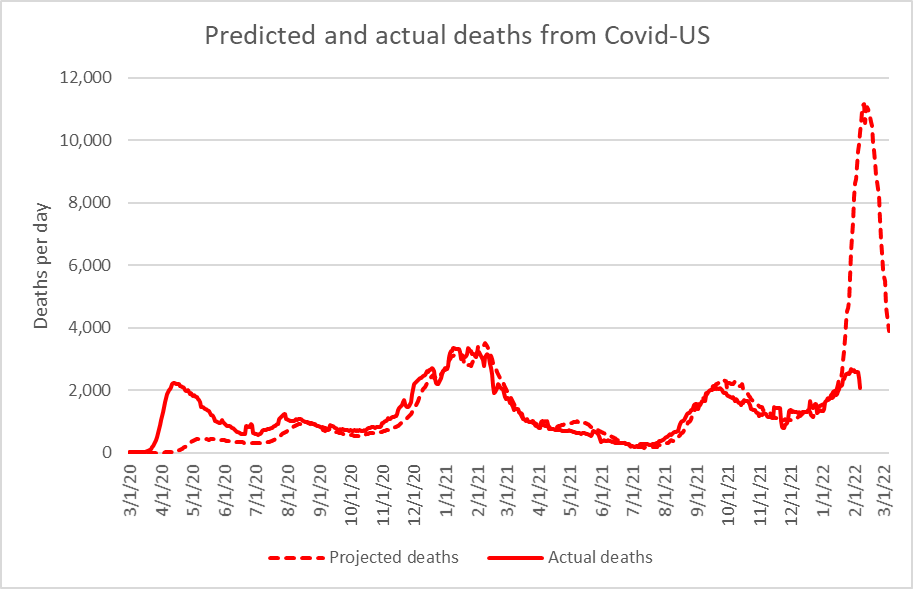
Predicted and actual deaths from Covid – U.S.
This pattern also holds for individual states. The next graph shows the actual number of covid deaths (the solid red line) in Wisconsin. In mid-January, Wisconsin cases of covid peaked to a level not seen before. The model developed using data from the previous two years then predicted a similar sharp spike in deaths, peaking in mid-February. So far, that is not happening.
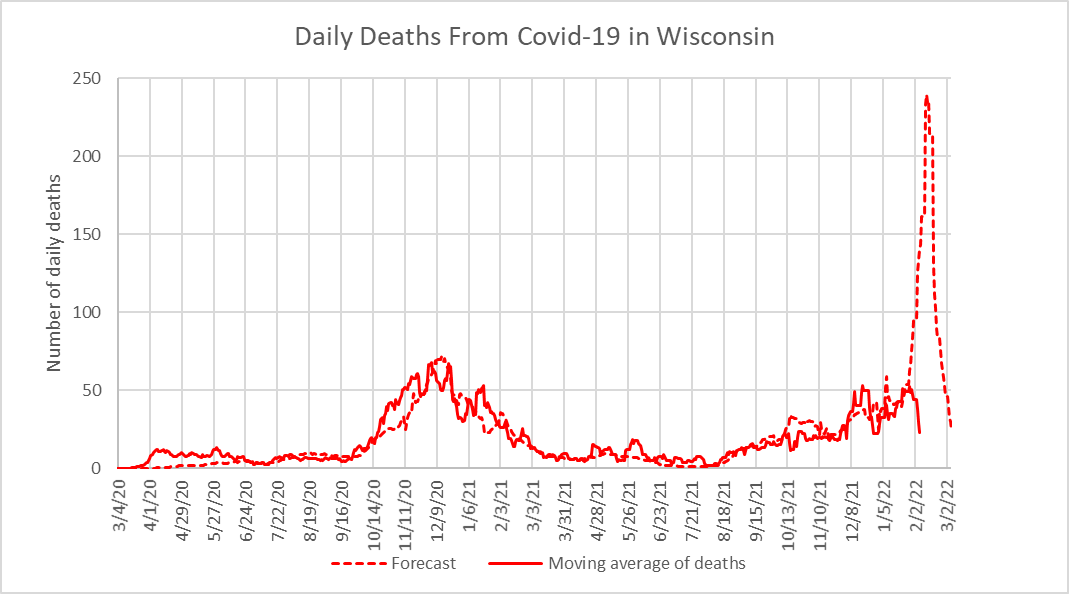
Daily Deaths From Covid-19 in Wisconsin
These results are consistent with early speculation that the omicron variant was both far more infectious than its predecessors, but far less lethal. The omicron variant rapidly displaced previous variants at the end of 2021 and the beginning of 2022. According to the CDC’s Data Tracker, between December 5th and January 22nd omicron’s share of all American covid infections jumped from less than 1% to 99%.
Because of the rapidity of omicron’s rise, relatively little has been established as to the effectiveness of the vaccines against it. It appears that the vaccines are less effective against omicron than its predecessors, but still bring a substantial advantage compared to being unvaccinated.
For the week ending December 4th, with the delta variant still ascendant, the CDC calculated that someone who was unvaccinated was around 4 times as likely to catch covid as someone fully vaccinated (defined as having two shots of the Pfizer or Moderna vaccine or one of the Johnson and Johnson) and almost 14 more likely than someone with the booster shot.By the week of December 25th, with the omicron market share at 74%, the vaccinated advantage in cases had dropped to 2.3 for those completely vaccinated and 3.9 for those with a booster shot.
Using data for December 4th, when the delta variant was still dominant, the vaccines were even more effective in preventing deaths than in preventing infections. Unvaccinated people were between 13 and 20 times as likely to die than those fully vaccinated and 95 times those with a booster.
Unfortunately, as of this writing, death rate estimates have not yet been released for weeks ending after December 4th, when omicron started to take over. The best estimate currently is that the vaccine will protect against the omicron variant, but less effectively than they did against earlier variants. An article in Healthline comparing the omicron to the delta variant concludes with this note of caution: “This is a developing story. We’ll update it as we learn more.”
Unfortunately, promoters of the Republican death cult will take advantage of this uncertainty to promote resistance to the vaccines. The cost of this resistance will be borne primarily by those who believe the various fictions that are being spread.
However, the costs will also be borne by society at large, with overloaded hospitals, in new variants, and with “breakthrough” infections suffered by those who were vaccinated.
If you think stories like this are important, become a member of Urban Milwaukee and help support real, independent journalism. Plus you get some cool added benefits.
More about the Coronavirus Pandemic
- Governors Tony Evers, JB Pritzker, Tim Walz, and Gretchen Whitmer Issue a Joint Statement Concerning Reports that Donald Trump Gave Russian Dictator Putin American COVID-19 Supplies - Gov. Tony Evers - Oct 11th, 2024
- MHD Release: Milwaukee Health Department Launches COVID-19 Wastewater Testing Dashboard - City of Milwaukee Health Department - Jan 23rd, 2024
- Milwaukee County Announces New Policies Related to COVID-19 Pandemic - David Crowley - May 9th, 2023
- DHS Details End of Emergency COVID-19 Response - Wisconsin Department of Health Services - Apr 26th, 2023
- Milwaukee Health Department Announces Upcoming Changes to COVID-19 Services - City of Milwaukee Health Department - Mar 17th, 2023
- Fitzgerald Applauds Passage of COVID-19 Origin Act - U.S. Rep. Scott Fitzgerald - Mar 10th, 2023
- DHS Expands Free COVID-19 Testing Program - Wisconsin Department of Health Services - Feb 10th, 2023
- MKE County: COVID-19 Hospitalizations Rising - Graham Kilmer - Jan 16th, 2023
- Not Enough Getting Bivalent Booster Shots, State Health Officials Warn - Gaby Vinick - Dec 26th, 2022
- Nearly All Wisconsinites Age 6 Months and Older Now Eligible for Updated COVID-19 Vaccine - Wisconsin Department of Health Services - Dec 15th, 2022
Read more about Coronavirus Pandemic here
Data Wonk
-
Who Do You Trust to Conduct Elections Fairly?
 Apr 6th, 2026 by Bruce Thompson
-
Is Non-Citizen Voting a Real Threat to Elections in Wisconsin?
Mar 18th, 2026 by Bruce Thompson
-
How Global Climate Change Affects Milwaukee
 Mar 11th, 2026 by Bruce Thompson


Great stuff Bruce. I know that the Wisconsin DHS is slated to release their “vaxxed vs unvaxxed” results for January next week, and let’s see the amount of gap that exists in both cases and severity. I’m betting there still will be one with regular vaccination, but a big difference in those who have been boosted (much lower severity, especially).
At this point there is no excuse to not be vaxxed. A case to be made for dropping the mask mandates is we are only protecting the unvaxxed and they don’t want or deserve our protection.