Statewide COVID-19 Hospitalizations Up 16 Percent, 30 Percent in Milwaukee County
New testing record set each of the past three days.
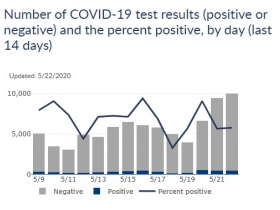
Wisconsin is entering Memorial Day weekend on a COVID-19 testing high. The Department of Health Services reports that 9,976 tests were processed in the past 24 hours, the third consecutive day a new high was established.
But the news is not entirely good. A total of 41 people were newly hospitalized in the past 24 hours. Across the state 416 people are hospitalized with the disease, an increase of 60 over last week, a 16.6 percent increase. In Milwaukee County, as of Thursday, hospitalizations were up 30 percent week over week.
State officials said yesterday that they believe the hospitalizations are a lagging indicator, three to five weeks behind changes on the ground, and not a direct result of the Wisconsin Supreme Court voiding the “Safer at Home” order.
The death toll from the virus has reached 496, with nine newly-confirmed deaths in the past 24 hours. Four percent of people with confirmed cases have died from the disease.
The percentage of people testing positive in the past 24 hours was 5.12 percent, below the seven-day average of 5.80 percent and 14-day average of 5.99 percent. May, to date, has had a positive test average of 6.80 percent.
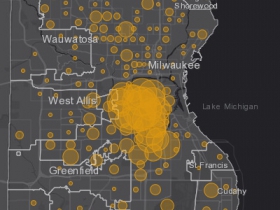
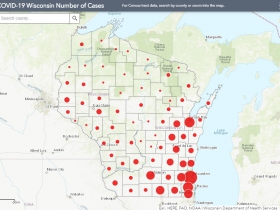
Milwaukee County is the site of 5,735 of the 14,396 confirmed cases and 270 of the 496 deaths according to state data.
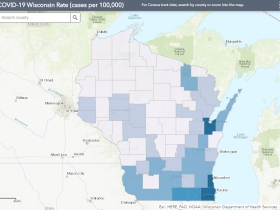
Both Brown and Racine counties continue to have greater per capita outbreaks than Milwaukee.
Brown County, which is anchored by Green Bay, has 848.4 cases per 100,000 residents (up from 838 yesterday). Racine County has 649.4 cases per 100,000 residents (up from 596.7). Milwaukee County has 601 cases per 100,000 residents (up from 582.3).
Kenosha (563.2), Rock (321.4), Walworth (319.4), Kewaunee (157.2), Grant (156.3), Dodge (156.1), Crawford (153.5), Fond du Lac (151.5) and Ozaukee (150.7) are the only other counties with more than 150 cases per 100,000 presidents.
The statewide average of cases per 100,000 residents has risen to 249.1 (up from 240.3).
There are currently 975 ventilators and 333 intensive care unit (ICU) beds available across the state according to the Wisconsin Hospital Association. Since the data became publicly available on April 10th, WHA has reported an average of 931 ventilators and 422 ICU beds as available.
Charts and Maps
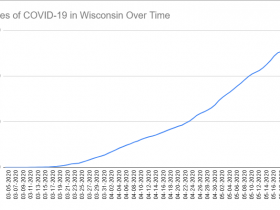
Wisconsin COVID-19 summary
| Status | Number (%) of People as of 5/22/2020 |
|---|---|
| Negative Test Results | 172,703 |
| Positive Test Results | 14,396 |
| Hospitalizations | 2,259 (16%) |
| Deaths | 496 |
Percent of COVID-19 cases by hospitalization status
| Hospitalization status | Number of confirmed cases as of 5/22/2020 | Percent of confirmed cases as of 5/22/2020 |
|---|---|---|
| Ever hospitalized | 2,259 | 16% |
| Never hospitalized | 8,198 | 57% |
| Unknown | 3,939 | 27% |
| Total | 14,396 | 100% |
Summary of COVID-19 cases by age group
| Age Group (Years) | Cases as of 5/22/2020 | Ever hospitalized as of 5/22/2020 | Any Intensive Care as of 5/22/2020 | Deaths as of 5/22/2020 |
|---|---|---|---|---|
| <10 | 293 | 12 | 1 | 0 |
| 10-19 | 790 | 25 | 2 | 0 |
| 20-29 | 2,435 | 108 | 18 | 4 |
| 30-39 | 2,565 | 161 | 26 | 5 |
| 40-49 | 2,446 | 260 | 63 | 13 |
| 50-59 | 2,315 | 391 | 98 | 44 |
| 60-69 | 1,694 | 491 | 148 | 80 |
| 70-79 | 942 | 427 | 104 | 135 |
| 80-89 | 617 | 281 | 54 | 121 |
| 90+ | 299 | 103 | 21 | 94 |
| Total | 14,396 | 2,259 | 535 | 496 |
Percent of COVID-19 cases and deaths by gender
| Gender | Confirmed Cases as of 5/22/2020 | Deaths as of 5/22/2020 |
|---|---|---|
| Female | 51% | 43% |
| Male | 49% | 57% |
| Unknown | 0% | 0% |
| Total Number | 14,396 | 496 |
Confirmed COVID-19 cases and deaths by race
| Race | Number of cases as of 5/22/2020 | Percent of cases as of 5/22/2020 | Number of deaths as of 5/22/2020 | Percent of deaths as of 5/22/2020 |
|---|---|---|---|---|
| American Indian | 164 | 1% | 7 | 1% |
| Asian or Pacific Islander | 541 | 4% | 12 | 2% |
| Black | 2,860 | 20% | 137 | 28% |
| White | 7,675 | 53% | 331 | 67% |
| Multiple or Other races | 1,687 | 12% | 2 | 0% |
| Unknown | 1,469 | 10% | 7 | 1% |
| Total | 14,396 | 100% | 496 | 100% |
Confirmed COVID-19 cases and deaths by ethnicity
| Ethnicity | Number of cases as of 5/22/2020 | Percent of cases as of 5/22/2020 | Number of deaths as of 5/22/2020 | Percent of deaths as of 5/22/2020 |
|---|---|---|---|---|
| Hispanic or Latino | 4,617 | 32% | 40 | 8% |
| Not Hispanic or Latino | 8,209 | 57% | 449 | 91% |
| Unknown | 1,570 | 11% | 7 | 1% |
| Total | 14,396 | 100% | 496 | 100% |
Number of positive cases and deaths by county
| Wisconsin County | Positive as of 5/22/2020 | Negative as of 5/22/2020 | Deaths as of 5/22/2020 | Rate (positive cases per 100,000 people) as of 5/22/2020 | Case fatality percentage (percent of cases who died) as of 5/22/2020 |
|---|---|---|---|---|---|
| Adams | 4 | 457 | 1 | 19.9 | 25% |
| Ashland | 2 | 345 | 0 | 12.7 | 0% |
| Barron | 11 | 1,458 | 0 | 24.3 | 0% |
| Bayfield | 3 | 360 | 1 | 20.0 | 33% |
| Brown | 2,204 | 11,048 | 31 | 848.4 | 1% |
| Buffalo | 5 | 545 | 1 | 38.0 | 20% |
| Burnett | 1 | 345 | 1 | 6.6 | 100% |
| Calumet | 67 | 1,152 | 1 | 134.5 | 1% |
| Chippewa | 46 | 2,016 | 0 | 72.3 | 0% |
| Clark | 28 | 626 | 4 | 81.2 | 14% |
| Columbia | 37 | 1,739 | 1 | 65.0 | 3% |
| Crawford | 25 | 641 | 0 | 153.5 | 0% |
| Dane | 587 | 22,002 | 26 | 110.8 | 4% |
| Dodge | 137 | 2,381 | 1 | 156.1 | 1% |
| Door | 35 | 776 | 3 | 127.6 | 9% |
| Douglas | 16 | 982 | 0 | 36.9 | 0% |
| Dunn | 21 | 1,681 | 0 | 47.2 | 0% |
| Eau Claire | 89 | 3,836 | 0 | 86.4 | 0% |
| Florence | 2 | 233 | 0 | 46.1 | 0% |
| Fond du Lac | 155 | 3,344 | 4 | 151.5 | 3% |
| Forest | 11 | 262 | 0 | 122.0 | 0% |
| Grant | 81 | 1,865 | 10 | 156.3 | 12% |
| Green | 49 | 1,007 | 0 | 132.9 | 0% |
| Green Lake | 13 | 502 | 0 | 69.3 | 0% |
| Iowa | 11 | 596 | 0 | 46.6 | 0% |
| Iron | 2 | 190 | 1 | 35.0 | 50% |
| Jackson | 15 | 793 | 1 | 73.1 | 7% |
| Jefferson | 75 | 2,002 | 3 | 88.6 | 4% |
| Juneau | 22 | 763 | 1 | 83.3 | 5% |
| Kenosha | 948 | 5,301 | 22 | 563.2 | 2% |
| Kewaunee | 32 | 517 | 1 | 157.2 | 3% |
| La Crosse | 48 | 4,050 | 0 | 40.7 | 0% |
| Lafayette | 17 | 409 | 0 | 101.6 | 0% |
| Langlade | 1 | 331 | 0 | 5.2 | 0% |
| Lincoln | 3 | 424 | 0 | 10.8 | 0% |
| Manitowoc | 28 | 1,390 | 1 | 35.3 | 4% |
| Marathon | 36 | 1,994 | 1 | 26.6 | 3% |
| Marinette | 30 | 1,567 | 2 | 74.0 | 7% |
| Marquette | 3 | 384 | 1 | 19.7 | 33% |
| Menominee | 2 | 621 | 0 | 43.7 | 0% |
| Milwaukee | 5,735 | 31,512 | 270 | 601.0 | 5% |
| Monroe | 16 | 1,675 | 1 | 35.2 | 6% |
| Oconto | 32 | 1,239 | 0 | 85.2 | 0% |
| Oneida | 7 | 602 | 0 | 19.8 | 0% |
| Outagamie | 174 | 5,132 | 5 | 94.2 | 3% |
| Ozaukee | 133 | 1,630 | 11 | 150.7 | 8% |
| Pepin | 1 | 321 | 0 | 13.8 | 0% |
| Pierce | 34 | 972 | 0 | 81.7 | 0% |
| Polk | 13 | 965 | 1 | 30.0 | 8% |
| Portage | 8 | 1,251 | 0 | 11.3 | 0% |
| Price | 2 | 273 | 0 | 14.8 | 0% |
| Racine | 1,269 | 6,924 | 22 | 649.4 | 2% |
| Richland | 14 | 509 | 4 | 79.8 | 29% |
| Rock | 520 | 5,301 | 15 | 321.4 | 3% |
| Rusk | 4 | 252 | 0 | 28.2 | 0% |
| Sauk | 77 | 2,453 | 3 | 121.1 | 4% |
| Sawyer | 7 | 864 | 0 | 42.8 | 0% |
| Shawano | 36 | 1,259 | 0 | 87.8 | 0% |
| Sheboygan | 78 | 2,216 | 3 | 67.7 | 4% |
| St. Croix | 58 | 1,966 | 0 | 66.0 | 0% |
| Taylor | 1 | 285 | 0 | 4.9 | 0% |
| Trempealeau | 13 | 1,099 | 0 | 44.2 | 0% |
| Vernon | 14 | 892 | 0 | 45.9 | 0% |
| Vilas | 6 | 316 | 0 | 27.8 | 0% |
| Walworth | 329 | 2,638 | 11 | 319.4 | 3% |
| Washburn | 2 | 396 | 0 | 12.7 | 0% |
| Washington | 178 | 2,782 | 4 | 132.3 | 2% |
| Waukesha | 537 | 8,598 | 25 | 134.6 | 5% |
| Waupaca | 20 | 1,119 | 1 | 38.9 | 5% |
| Waushara | 7 | 610 | 0 | 29.0 | 0% |
| Winnebago | 160 | 4,255 | 1 | 94.2 | 1% |
| Wood | 9 | 1,462 | 0 | 12.3 | 0% |
| Total | 14,396 | 172,703 | 496 | 249.1 | 3% |
If you think stories like this are important, become a member of Urban Milwaukee and help support real, independent journalism. Plus you get some cool added benefits.




Is there a source that tracks the improvement in testing turnaround time? I hear it is about a week. Workers stay home awaiting results. Not good for the worker and not good for the employer.