
Examining Wisconsin Gerrymandering By Analyzing 2022 Election Results
The present Wisconsin gerrymander is a tool for assuring continued one-party rule.
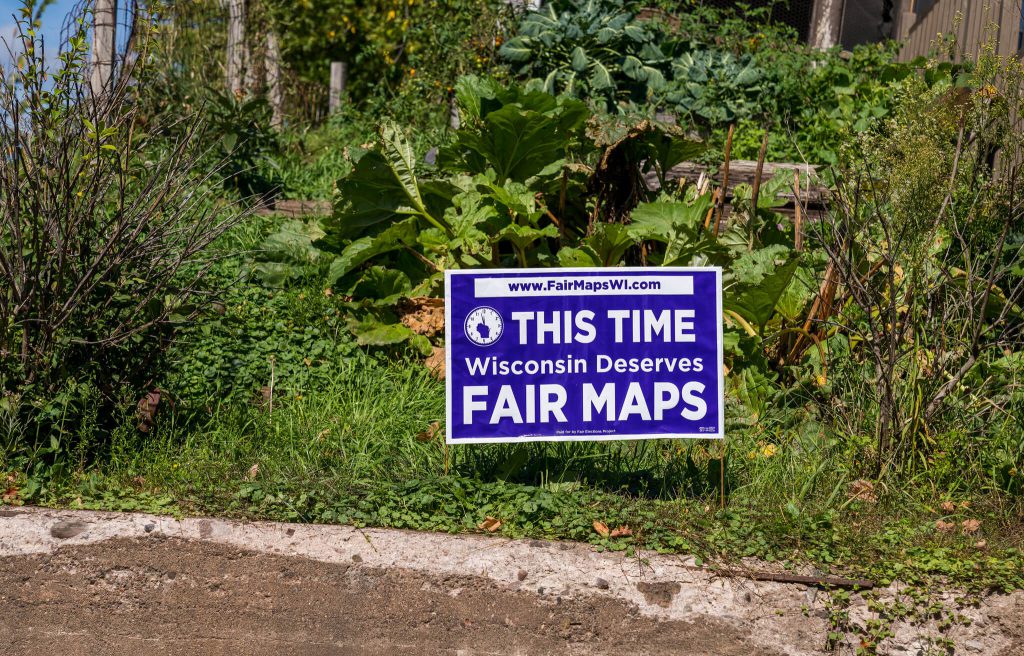
A yard sign in Mellen, Wisconsin reads: “This Time Wisconsin Deserves Fair Maps,” paid for by the Fair Elections Project, FairMapsWI.com. The political sign supports redistricting legislation to reform gerrymandering. Wisconsin Fair Maps Coalition by Tony Webster (CC BY 2.0) https://creativecommons.org/licenses/by/2.0/
Following the 2020 U.S. Census, the Wisconsin Supreme Court declared that its rule for choosing among proposed maps for state legislative districts would be based on which resulted in the least change to the existing map. Since the previous map was developed with the aim of locking in an overwhelming Republican election advantage, the court’s decision continued one-party rule of the state legislature.
Rather than choose the map that offered the least change from 2010’s gerrymander, a better approach would have been to choose a map that minimized favorization to either party. By making it much harder for one party to translate votes into legislative seats, the state supreme court joined those aiming to undermine American democracy.Last November’s election offers a window into how Wisconsin’s legislative district map acts in practice. One challenge in analyzing the current legislative map is posed by the 26 districts in which only one of the two major parties fielded a candidate. In the 2022 election, Democrats offered candidates in 83 of Wisconsin’s 99 Assembly districts, while Republicans had 89. Thus, 26 of the districts–a quarter of the total–were uncontested in the most recent election. How should those uncontested districts be counted? I can think of three possible strategies for these districts.
The first is to drop the 74 one-party districts from the analysis. In doing so, however, one is also dropping districts heavily oriented to one or the other of the two parties. The chart below shows the vote for the Republican Assembly candidate on the vertical axis compared to the vote for Tim Michels, the Republican candidate for governor) on the horizontal axis.
Over most of the districts, the votes for the two offices align quite closely. However, at around the 20,000 vote mark there are a number of districts in which the candidate for Assembly received more votes than did Michels. This seems to run counter to the rule that down-ballot races receive less interest than those at the top of the ballot. What could explain this?

Vote for Governor
The next chart offers an explanation. It divides the Republican Assembly districts into two groups. Red triangles show the Republican vote in districts where there was also a Democrat on the ballot. The circles show Republican votes in districts that Democrats chose not to contest. (As before, the vertical scale shows the vote for the Republican Assembly candidate, while the horizontal axis shows the Republican vote for governor in the same district.)
Before doing this analysis, I expected the opposite result: that the votes in one-party districts would be lower for district candidates than for state-wide candidates; in other words, if the only local candidate was Republican, a Democratic voter would skip the Assembly vote and a Republican voter, noting that the Republic candidate was assured of success, might also skip voting. In practice, just the opposite occurred: apparently some number of Democrats voted for Republicans when a Democrat was not on the ballot.
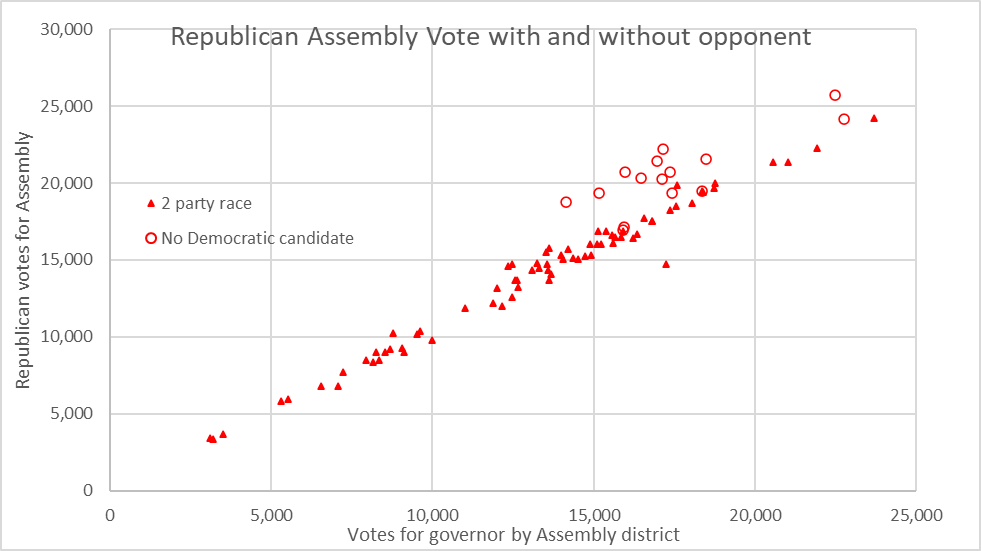
Republican Assembly Vote with and without opponent
A second possible strategy for dealing with one-party districts would be to drop them from the analysis entirely. This would have the effect of eliminating districts with the greatest concentration of Democratic voters.
The strategy underlying the Wisconsin gerrymander is known as “packing and cracking.” In Wisconsin, Democratic voters are “packed” into a limited number of districts. This allows “cracking” a larger number of Democratic or competitive districts, converting them into majority-Republican districts.
In the districts won by Mandela Barnes, 71% of the voters supported Barnes for U.S. Senator. By comparison, only 62% of voters in districts won by Ron Johnson supported him. This allowed Johnson to win almost twice as many districts as Barnes.A third possible approach to handling the one-party districts consists of two steps. The first uses regression on the two-party districts to derive a relationship between Assembly district votes and those in the same districts for a statewide position such as U.S. Senate. Then that equation is used to estimate the likely vote if a candidate from the missing party were to suddenly appear.
In contrast to Assembly races in which the results in most districts are pre-ordained, in a statewide race every vote is valuable whether it comes from a highly competitive district or one which heavily favors a single party. The next chart shows the result of this approach.
The horizontal axis shows the percentage of the vote that supported the Democratic candidate for U.S. Senate. The vertical axis shows the percentage of votes the Democratic Assembly candidate received or would have received. (For simplicity, only the two major parties were included in the analysis.)
The yellow dots show the Democratic percentage of the two-party vote in two-party districts. The votes for one-party districts derived from the U.S. Senate contest are shown in purple.
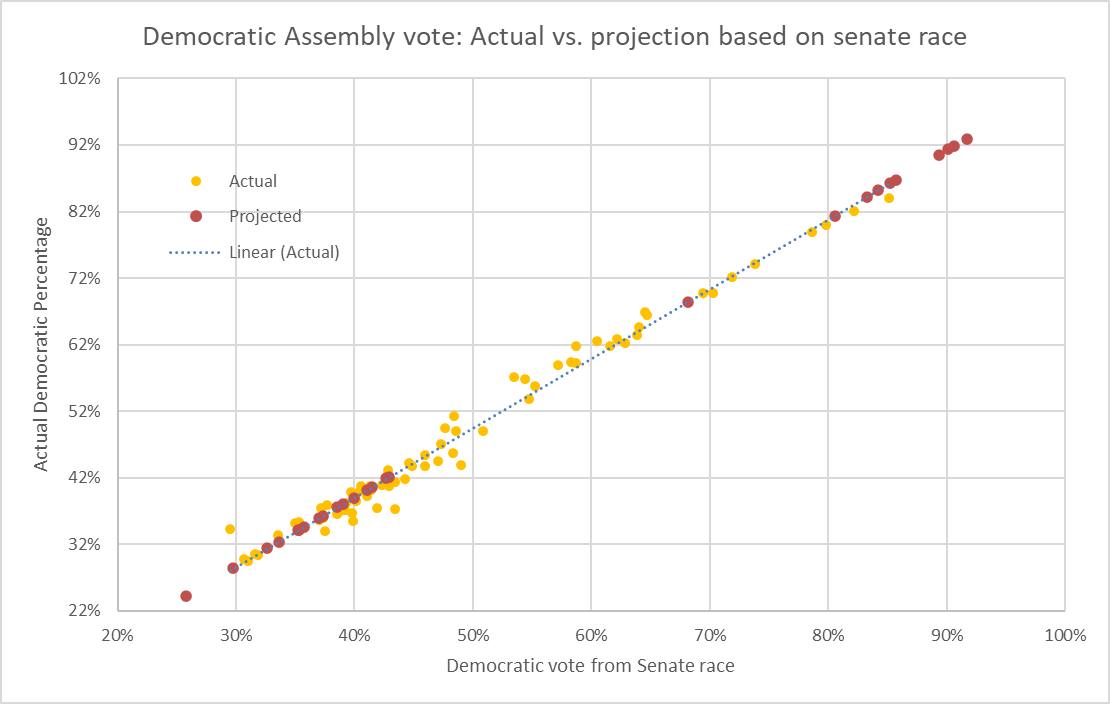
Democratic Assembly vote: Actual vs. projection based on senate race
The next chart was derived by increasing and decreasing the percentage of the vote won by Democrats and Republicans in increments of half a percent in the range stretching between 40% and 60%. It was assumed that the percentage increase or decrease was distributed evenly to every district.
To interpret this chart, first pick the percentage of votes won on the horizontal axis. Then read up to the blue or red line. For instance, assume that Democrats won 55% of the vote. This translates into winning about 40 of the state’s 99 districts. By contrast, for Republicans to win 55% of the vote translates into 66 of the districts.
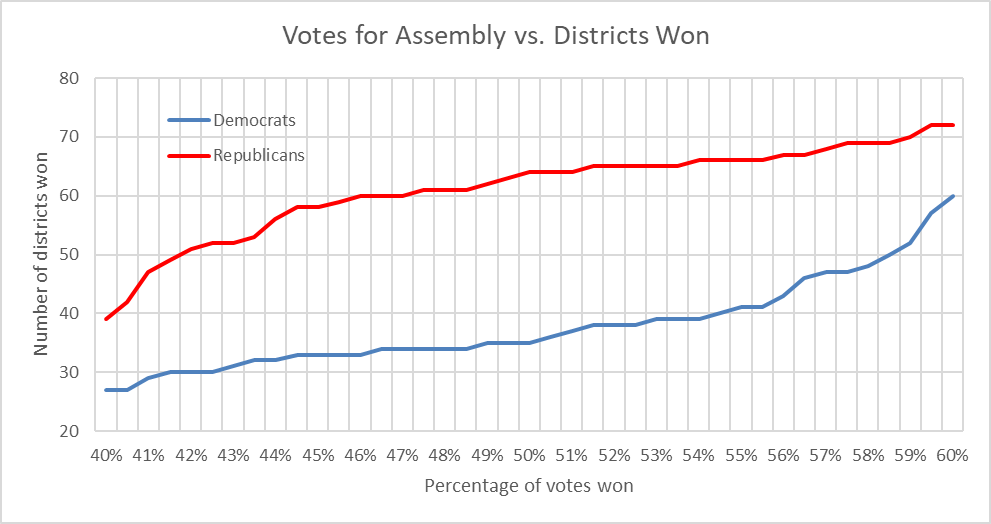
Votes for Assembly vs. Districts Won
Ideally, one test of a democracy is whether majorities rule. The Wisconsin gerrymander dramatically fails this rule. Winning half the votes falls very short of leading to a tied legislature. Instead it leads to 35 Democratic seats and 64 Republican districts, two seats away from the number needed to sustain a veto.
For the model to predict a Democratic majority in the state Assembly would require Democrats to win at least 58.5% of the statewide vote. Essentially, then, the present Wisconsin gerrymander is a tool for assuring continued one-party rule.
It can be viewed as one element in the worldwide attack on democracy. It is particularly disturbing therefore that those particularly charged with protecting democracy under our constitution—the justices of our state and national Supreme Courts—have been AWOL when it comes to attempts to lock in the powers of one group of voters.
More about the Gerrymandering of Legislative Districts
- Without Gerrymander, Democrats Flip 14 Legislative Seats - Jack Kelly, Hallie Claflin and Matthew DeFour - Nov 8th, 2024
- Op Ed: Democrats Optimistic About New Voting Maps - Ruth Conniff - Feb 27th, 2024
- The State of Politics: Parties Seek New Candidates in New Districts - Steven Walters - Feb 26th, 2024
- Rep. Myers Issues Statement Regarding Fair Legislative Maps - State Rep. LaKeshia Myers - Feb 19th, 2024
- Statement on Legislative Maps Being Signed into Law - Wisconsin Assembly Speaker Robin Vos - Feb 19th, 2024
- Pocan Reacts to Newly Signed Wisconsin Legislative Maps - U.S. Rep. Mark Pocan - Feb 19th, 2024
- Evers Signs Legislative Maps Into Law, Ending Court Fight - Rich Kremer - Feb 19th, 2024
- Senator Hesselbein Statement: After More than a Decade of Political Gerrymanders, Fair Maps are Signed into Law in Wisconsin - State Senate Democratic Leader Dianne Hesselbein - Feb 19th, 2024
- Wisconsin Democrats on Enactment of New Legislative Maps - Democratic Party of Wisconsin - Feb 19th, 2024
- Governor Evers Signs New Legislative Maps to Replace Unconstitutional GOP Maps - A Better Wisconsin Together - Feb 19th, 2024
Read more about Gerrymandering of Legislative Districts here
Data Wonk
-
Who Do You Trust to Conduct Elections Fairly?
 Apr 6th, 2026 by Bruce Thompson
-
Is Non-Citizen Voting a Real Threat to Elections in Wisconsin?
Mar 18th, 2026 by Bruce Thompson
-
How Global Climate Change Affects Milwaukee
 Mar 11th, 2026 by Bruce Thompson


We are still complaining about partisian maps!? Has this author been to my state of Ilinois?
This is a very good analysis. With three Constitutional Amendments related to voting, one would think that the courts would demand maps where the voter choose the candidates and not where the candidates choose the voters. The legal concept being promoted now in conservative legal circles of “originalism” is simply a way to find obscure laws and common practices, some going back hundreds of years, to manufacture phony precedents to justify political outcomes.
Ryan,
Move to WI you will see how a permanent rightwing thug legislature punishes Milwaukee and has become an authoritarian lazy parasites, a useless mass of Trump loving lunatics that kill their own constituents, takes the state backwards, grift a foxcon, and incapable of doing something that doesn’t include Tax cuts for the rich with my tax dollars.
Even though every year democrats get more votes, yet have no chance of taking any part of the legislature. Why is the minority in control.
Wi Republicans are authoritarian fat, stupid, lazy, white supremacist lunatics with only 1 agenda. Power at all