
We Won Wisconsin Big!
Actually Trump was defeated by Trump — as state and national voting patterns show.

Official portrait of President Donald J. Trump, Friday, October 6, 2017. Official White House photo by Shealah Craighead. Photo is in the Public Domain.
Even while votes were being tabulated following the November 3rd presidential election, Donald Trump insisted he had won the election. Seven weeks later he continues to insist he won, often making the claim multiple times a day. Here is a tweet that singles out Wisconsin:
We won Wisconsin big. They rigged the vote! https://t.co/TRBRmBiMtv
— Donald J. Trump (@realDonaldTrump) December 18, 2020
This tweet combines two assertions and Trump has offered no evidence for either one. To the extent there was any logic behind these claims it seems to run like this: he was sure he would win and the fact that he did not could only be explained by a rigged vote.
Judging by his twitter output, Trump has spent most of his time and energy since his defeat complaining about the outcome and plotting ways to reverse it. There is almost no attention paid to the exploding COVID-19 cases and deaths or to the discovery of the massive cyber attack on the federal government computer system, for instance. His only attention to the latter is a tweet denying Russia was at fault.
In a tweet from December 16th, Trump attempted to develop the Rigged Election!!! theme.
Perhaps the biggest difference between 2016 and 2020 is @FoxNews, despite the fact that I went from 63,000,000 Votes to 75,000,000 Votes, a record 12,000,000 Vote increase. Obama went down 3,000,000 Votes, and won. Rigged Election!!!
— Donald J. Trump (@realDonaldTrump) December 16, 2020
The chart below shows the results of the last four elections for president. Trump is correct that Barack Obama’s vote total dropped between 2008 and 2012. However, it was still greater than his opponent’s.
Likewise, Trump’s vote went up, by a bit more than 11 million. However, this was well short of Joe Biden’s increase of 15.4 million. As a result, Biden’s vote total exceeds Trump’s by 7 million.
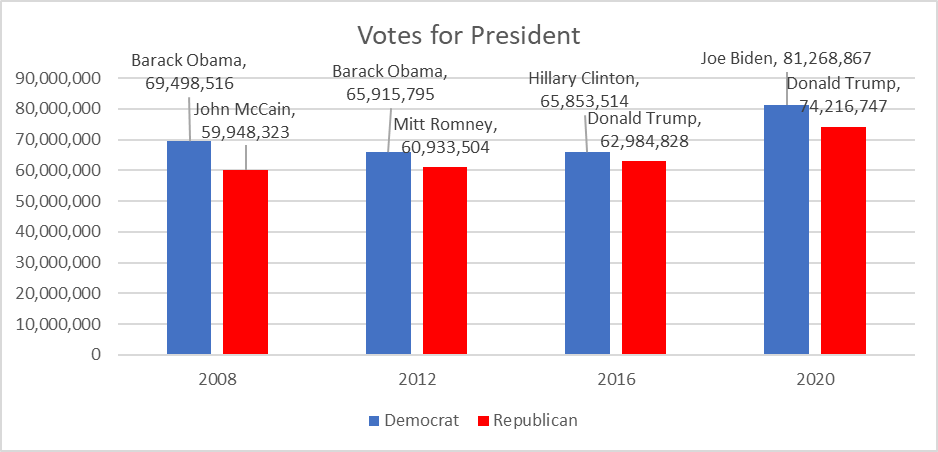
Votes for President
Of course, winning the presidency is determined by the electoral college, not by the total vote count. As the next chart shows, the electoral college doesn’t always reflect the vote total, which explains Trump’s 2016 victory over Hillary Clinton.
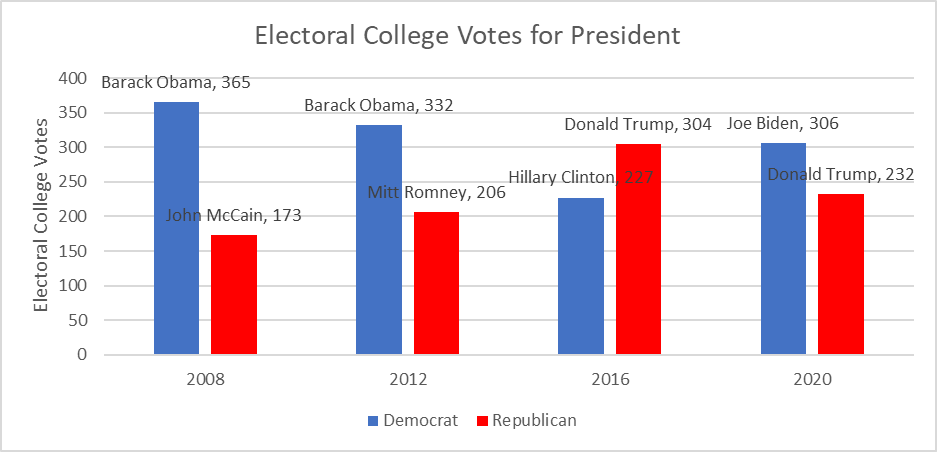
Electoral College Votes for President
One really striking thing about these elections is how many more people voted in 2020 than in 2016. In every Wisconsin county, both Trump and his opponent received substantially more votes in 2020 than they did in 2016. The vertical scale in the chart below shows the percentage increase in votes for Biden compared to those for Clinton four years earlier. These increases are plotted against the number of votes for Clinton in 2016.
(Note that the horizontal scale is logarithmic, meaning that every vertical line is ten times the previous line. This is done to avoid a graph in which the many small counties are squashed against the left border in order to fit in Milwaukee and Dane counties.)
The fact that the trend line is flat suggests that there is little or no relationship between the 2016 Clinton vote and the increase in Biden’s 2020 vote increase. On average he received 18% more votes than Clinton. However, the increase was over 30% in Ozaukee and Waukesha counties and as low as 10% in Milwaukee County.
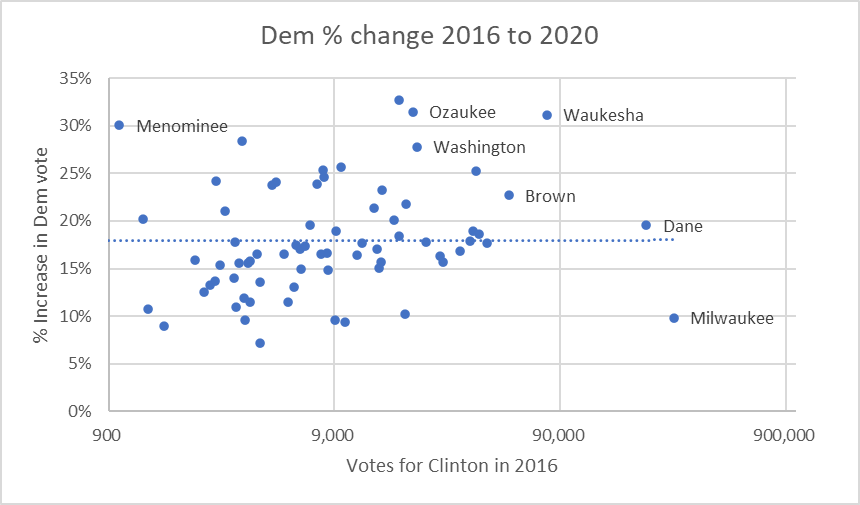
Dem % change from 2016 to 2020
The next graph shows the same information for the Trump 2016 and 2020 campaigns. The dotted trend line slopes downward, suggesting that voters in some of the largest counties, such as Waukesha and Milwaukee, did not increase their turnout to the same extent as did those in the small counties.
(Note that the red dotted trend line is a linear trend. Imagine that the graph is printed on elastic material, which is then stretched on the right, until every interval is the same size. Then the trend line would become a straight line, sloping downward to the right.)
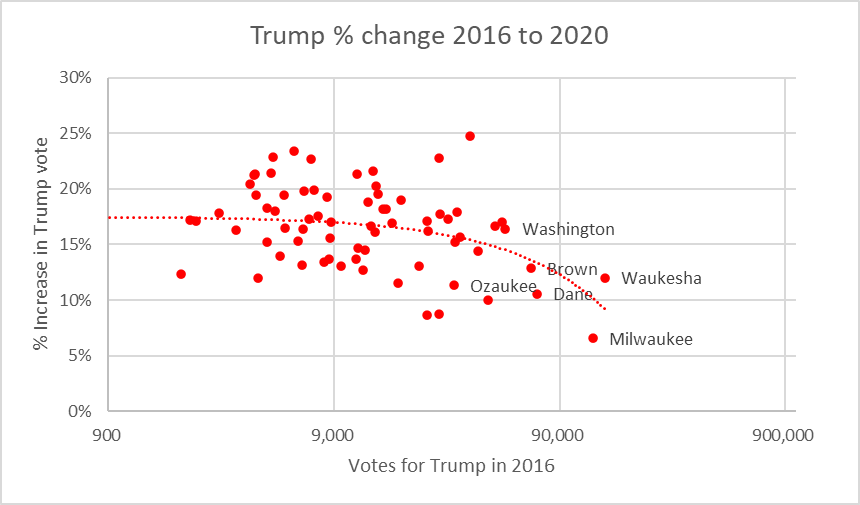
Trump % change 2016 to 2020
On average, Wisconsin counties’ votes for Biden were 18% higher than their vote for Clinton. The Trump votes in 2020 were also greater than in 2016, but only 15% greater on average. Thus, Trump got more votes in 2020 than in 2016, but not as much as Biden did.
The same pattern held nationally–growth in votes for both candidates, but greater for the Democratic candidate than the Republican. The states were divided into three groups: red states that ended up supporting Trump, the 6 very competitive states that ended voting for Biden (Arizona, Georgia, Michigan, Nevada, Pennsylvania, and Wisconsin) and blue states that supported Biden.
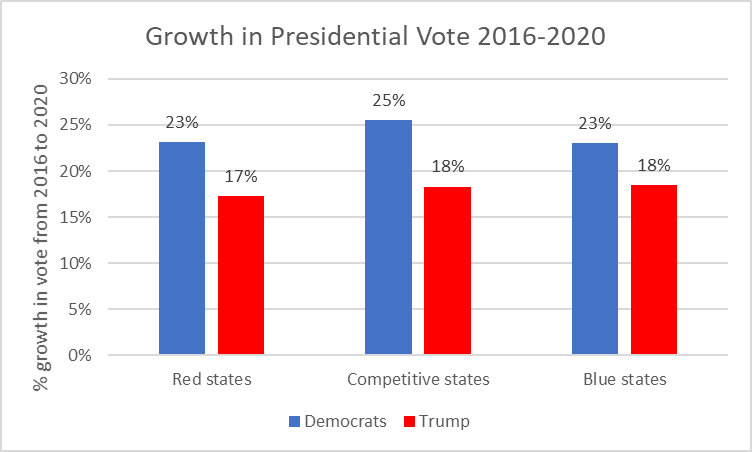
Growth in Presidential Vote 2016-2020
All three groups of states follow the same pattern: substantial growth in both Democratic and Republican votes, but more growth on the Democratic side. The fact that this pattern holds for all three groups suggests the election results reflect the characteristics of the 2020 voting public rather than how the elections were run.
If I were charged to look for fraudulent voting, I would look for anomalies, some pattern that does not fit other states. For someone planning significant election fraud, enough to overturn results in a particular state or set of states, there is quandary: how do you predict ahead of time what the voting results will be so you can plan your fraud accordingly? The widespread failure of pollsters for two presidential elections in a row shows how difficult such predictions can be. Small wonder that repeated research has found very few examples of fraud occurring in U.S. elections, much less on the scale Trump has claimed.The substantial increase in voting in red, blue, and contested states reflects Trump’s effectiveness in motivating people to turn out and vote. Unfortunately for him it also shows he is consistently more effective in motivating opponents than supporters.
Trump continues to blame “people voting from out of state, illegals, dead people, no signatures” for his loss in the election. However, he has been unable to produce any evidence that this is true.
Chris Krebs was totally excoriated and proven wrong at the Senate Hearing on the Fraudulent 2020 Election. Massive FRAUD took place with machines, people voting from out of state, illegals, dead people, no signatures—and so much more!
— Donald J. Trump (@realDonaldTrump) December 16, 2020
Trump is wrong to blame fraud for his loss. Instead, he should blame 2020 voters who skipped the 2016 election. After four years of his governing, they decided they had to vote to turn him out of office.
Data Wonk
-
Who Do You Trust to Conduct Elections Fairly?
 Apr 6th, 2026 by Bruce Thompson
-
Is Non-Citizen Voting a Real Threat to Elections in Wisconsin?
Mar 18th, 2026 by Bruce Thompson
-
How Global Climate Change Affects Milwaukee
 Mar 11th, 2026 by Bruce Thompson


Great piece Bruce. A clear explanation of how Biden did in fact prevail without cheating …
As usual, Bruce relies on factual evidence, explains the solid data, and presents conclusions that are based on the data. How unlike those who keep tweeting and screaming about hoaxes, fraud, and rigged elections.
Democratic candidates won the popular vote by wide margins in all recent elections. Could we consider getting rid of the electoral college?