Waukesha, Washington Counties Have Faster COVID-19 Spreads Than Milwaukee
Milwaukee, Racine, Ozaukee counties all see declining spreads, Waukesha and Washington accelerating.
The latest COVID-19 activity level report from the Department of Health Services shows that nine counties in the state have faster per-capita disease spreads in the past two weeks than Milwaukee County. Included among those are the county’s western and northwestern neighbors Waukesha and Washington counties.
Milwaukee’s other two bordering counties, Ozaukee and Racine, also have per-capita case levels above the state average of 182.7 cases per 100,000 residents over the past 14 days.
Milwaukee’s rate fell for the second straight week, as did the rates in Racine and Ozaukeee counties, but Waukesha and Washington counties saw their spreads accelerate. The state per-capita total fell from 194.
Waukesha’s total grew from 280.5 to 290.2 and Washington’s total grew from 273.6 to 278.8.
Milwaukee’s total fell from 278.1 to 252.1, Ozaukee’s fell from 259.2 to 238.7 and Racine’s fell from 286.8 to 205.9.
Marinette County has the highest per-capita total in the state, 422.6 or more than 4 out of every 100 residents, but because of its population the actual total is only 173.
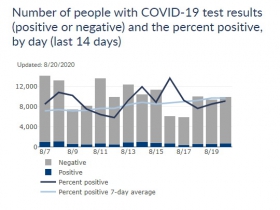
The seven- and 14-day rate positive case rates stand at 7.96 and 7.37 percent, the latter at its highest point since early May.
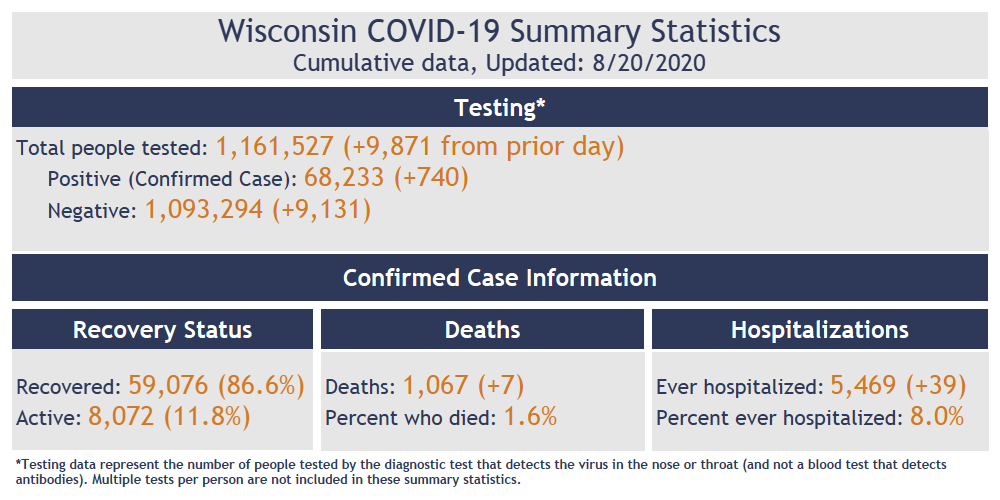
A total of 68,233 Wisconsin residents have tested positive for the disease since the outbreak began, with 5,027 in the past week and 10,454 in the past 14 days. DHS reports that 87 percent of individuals with a confirmed case have “recovered,” as defined by a documented abatement of symptoms or a diagnosis over 30 days ago. A total of 63,126 tests have been processed in the past seven days
The death toll from the disease grew to 1,067, an increase of eight in the past 24 hours. The state has averaged 6.93 deaths per day over the past 30 days and 6.49 per day over the past 100 days.
According to DHS data, 2,387.1 out of every 100,000 Milwaukee County residents have tested positive for COVID-19 (up from 2,363.8) since the outbreak began. Racine County has 1,925.3 cases per 100,000 residents (up from 1,916.6). Brown County, which is anchored by Green Bay, has 1,802.3 cases per 100,000 residents (up from 1,792.2).
Iron (1,714.8), Kenosha (1,688.9), Walworth (1,500.8), Trempealeau (1,321.4), Marinette (1,307.4), Waukesha (1,269.3), Dodge (1,118.8), Waupaca (1,094.4), Lafayette (1,063.6) and Washington (1,008.7) are the only other counties with more than 1,000 cases per 100,000 residents.
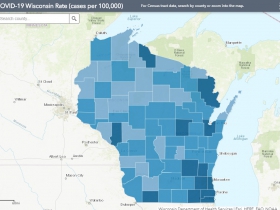
The statewide average of cases per 100,000 residents rose to 1,180.8 (up from 1,168 yesterday). Wisconsin has recorded a per-capita rate of 182.7 per 100,000 in the past two weeks according to the DHS activity level report released Wednesday.
Charts and Maps
Percent of COVID-19 cases by hospitalization status
| Hospitalization status | Number of confirmed cases as of 8/20/2020 | Percent of confirmed cases as of 8/20/2020 |
|---|---|---|
| Ever hospitalized | 5,469 | 8% |
| Never hospitalized | 39,840 | 58% |
| Unknown | 22,924 | 34% |
| Total | 68,233 | 100% |
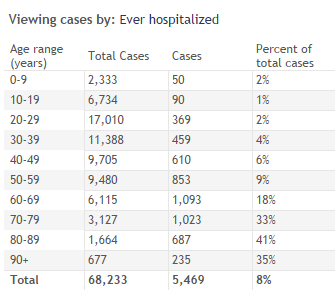
Percent of COVID-19 cases resulting in hospitalization within age group
Confirmed COVID-19 cases and deaths by gender
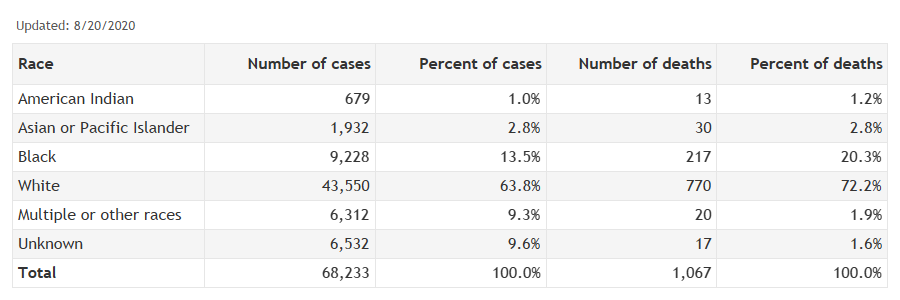
Confirmed COVID-19 cases and deaths by race
Confirmed COVID-19 cases and deaths by ethnicity
Number of positive cases and deaths by county
| Wisconsin County | Positive as of 8/20/2020 | Negative as of 8/20/2020 | Deaths as of 8/20/2020 | Rate (positive cases per 100,000 people) as of 8/20/2020 | Case fatality percentage (percent of cases who died) as of 8/20/2020 |
|---|---|---|---|---|---|
| Adams | 97 | 2,947 | 2 | 483.2 | 2% |
| Ashland | 30 | 1,887 | 1 | 190.9 | 3% |
| Barron | 346 | 6,819 | 3 | 764.6 | 1% |
| Bayfield | 40 | 2,223 | 1 | 266.8 | 3% |
| Brown | 4,682 | 55,345 | 57 | 1802.3 | 1% |
| Buffalo | 50 | 1,837 | 2 | 379.7 | 4% |
| Burnett | 31 | 1,889 | 1 | 203.2 | 3% |
| Calumet | 417 | 7,247 | 2 | 837.2 | 0% |
| Chippewa | 288 | 11,342 | 0 | 452.6 | 0% |
| Clark | 206 | 4,058 | 8 | 597.3 | 4% |
| Columbia | 307 | 10,923 | 2 | 539.0 | 1% |
| Crawford | 93 | 3,754 | 0 | 571.0 | 0% |
| Dane | 4,955 | 151,169 | 39 | 935.2 | 1% |
| Dodge | 982 | 17,867 | 5 | 1118.8 | 1% |
| Door | 121 | 4,926 | 3 | 441.0 | 2% |
| Douglas | 233 | 5,836 | 0 | 536.8 | 0% |
| Dunn | 150 | 6,213 | 0 | 337.1 | 0% |
| Eau Claire | 687 | 16,581 | 4 | 667.0 | 1% |
| Florence | 17 | 688 | 0 | 392.0 | 0% |
| Fond du Lac | 844 | 16,630 | 8 | 824.9 | 1% |
| Forest | 62 | 1,094 | 4 | 687.5 | 6% |
| Grant | 410 | 10,051 | 16 | 791.1 | 4% |
| Green | 229 | 5,620 | 1 | 621.2 | 0% |
| Green Lake | 67 | 2,746 | 0 | 357.2 | 0% |
| Iowa | 106 | 4,152 | 0 | 448.8 | 0% |
| Iron | 98 | 1,294 | 1 | 1714.8 | 1% |
| Jackson | 65 | 5,798 | 1 | 317.0 | 2% |
| Jefferson | 765 | 14,606 | 6 | 903.7 | 1% |
| Juneau | 162 | 6,620 | 1 | 613.2 | 1% |
| Kenosha | 2,843 | 31,015 | 60 | 1688.9 | 2% |
| Kewaunee | 149 | 2,812 | 2 | 731.8 | 1% |
| La Crosse | 1,008 | 19,671 | 1 | 855.3 | 0% |
| Lafayette | 178 | 2,618 | 0 | 1063.6 | 0% |
| Langlade | 75 | 2,543 | 2 | 391.4 | 3% |
| Lincoln | 73 | 3,720 | 1 | 262.1 | 1% |
| Manitowoc | 429 | 11,582 | 1 | 540.3 | 0% |
| Marathon | 718 | 16,226 | 13 | 530.8 | 2% |
| Marinette | 530 | 7,976 | 5 | 1307.4 | 1% |
| Marquette | 81 | 2,340 | 1 | 532.6 | 1% |
| Menominee | 28 | 1,843 | 0 | 611.5 | 0% |
| Milwaukee | 22,778 | 207,616 | 474 | 2387.1 | 2% |
| Monroe | 254 | 7,956 | 2 | 558.2 | 1% |
| Oconto | 327 | 6,711 | 2 | 870.7 | 1% |
| Oneida | 187 | 5,885 | 0 | 529.1 | 0% |
| Outagamie | 1,484 | 29,275 | 16 | 803.2 | 1% |
| Ozaukee | 824 | 14,306 | 18 | 933.4 | 2% |
| Pepin | 46 | 1,108 | 0 | 633.4 | 0% |
| Pierce | 256 | 5,463 | 4 | 615.3 | 2% |
| Polk | 150 | 6,789 | 2 | 346.0 | 1% |
| Portage | 487 | 10,069 | 0 | 689.8 | 0% |
| Price | 33 | 2,017 | 0 | 244.6 | 0% |
| Racine | 3,762 | 50,694 | 85 | 1925.3 | 2% |
| Richland | 38 | 3,213 | 4 | 216.7 | 11% |
| Rock | 1,514 | 27,307 | 26 | 935.9 | 2% |
| Rusk | 22 | 1,513 | 1 | 155.1 | 5% |
| Sauk | 547 | 15,595 | 3 | 860.1 | 1% |
| Sawyer | 127 | 3,488 | 0 | 775.8 | 0% |
| Shawano | 223 | 7,051 | 0 | 543.8 | 0% |
| Sheboygan | 903 | 17,716 | 8 | 783.8 | 1% |
| St. Croix | 554 | 11,999 | 6 | 630.1 | 1% |
| Taylor | 78 | 2,122 | 2 | 383.2 | 3% |
| Trempealeau | 389 | 5,304 | 2 | 1321.4 | 1% |
| Vernon | 80 | 4,320 | 0 | 262.2 | 0% |
| Vilas | 89 | 3,193 | 0 | 412.2 | 0% |
| Walworth | 1,546 | 18,712 | 25 | 1500.8 | 2% |
| Washburn | 52 | 2,252 | 0 | 331.4 | 0% |
| Washington | 1,357 | 18,312 | 25 | 1008.7 | 2% |
| Waukesha | 5,063 | 62,907 | 70 | 1269.3 | 1% |
| Waupaca | 563 | 8,550 | 16 | 1094.4 | 3% |
| Waushara | 128 | 5,609 | 1 | 530.8 | 1% |
| Winnebago | 1,321 | 30,810 | 19 | 777.4 | 1% |
| Wood | 399 | 10,924 | 2 | 544.5 | 1% |
| Total | 68,233 | 1,093,294 | 1,067 | 1180.8 | 2% |
If you think stories like this are important, become a member of Urban Milwaukee and help support real, independent journalism. Plus you get some cool added benefits.
More about the Coronavirus Pandemic
- Governors Tony Evers, JB Pritzker, Tim Walz, and Gretchen Whitmer Issue a Joint Statement Concerning Reports that Donald Trump Gave Russian Dictator Putin American COVID-19 Supplies - Gov. Tony Evers - Oct 11th, 2024
- MHD Release: Milwaukee Health Department Launches COVID-19 Wastewater Testing Dashboard - City of Milwaukee Health Department - Jan 23rd, 2024
- Milwaukee County Announces New Policies Related to COVID-19 Pandemic - County Executive David Crowley - May 9th, 2023
- DHS Details End of Emergency COVID-19 Response - Wisconsin Department of Health Services - Apr 26th, 2023
- Milwaukee Health Department Announces Upcoming Changes to COVID-19 Services - City of Milwaukee Health Department - Mar 17th, 2023
- Fitzgerald Applauds Passage of COVID-19 Origin Act - U.S. Rep. Scott Fitzgerald - Mar 10th, 2023
- DHS Expands Free COVID-19 Testing Program - Wisconsin Department of Health Services - Feb 10th, 2023
- MKE County: COVID-19 Hospitalizations Rising - Graham Kilmer - Jan 16th, 2023
- Not Enough Getting Bivalent Booster Shots, State Health Officials Warn - Gaby Vinick - Dec 26th, 2022
- Nearly All Wisconsinites Age 6 Months and Older Now Eligible for Updated COVID-19 Vaccine - Wisconsin Department of Health Services - Dec 15th, 2022
Read more about Coronavirus Pandemic here






I wish there was a simple metric the media could adopt that illustrates the up or down trend. Maybe the seven-day average expanded to a two-week average, or a 30-day average of new cases. I find the current batch of numbers bewildering. I just want to know what progress we are making.
There is regrettably not such a figure, but there are a few that I would suggest keeping an eye on.
1. The positive case rate – it should trend downward if cases are slowing (particularly if testing is expanding). It is currently trending up substantially as testing contracts (a likely indicator that more people should be tested).
2. Total cases – a surge in total cases, including what was seen in much of July, will lead to more hospitalizations and deaths in the future (what is being seen now)
3. New hospitalizations and active hospitalizations – these are both lagging indicators but indicators none the less. Daily new hospitalizations, on a rolling 30-day-average, are near an all-time high set a week or two ago. Active hospitalizations are not at an all-time high (but are elevated compared to a month ago), the why is the interesting question. Have strategies gotten better? Are cases less severe because of limited exposure (masks, shorter contact, etc, etc)? Or because it’s younger people being admitted? No easy answer there.
4. Deaths – Another lagging indicator. The death rate is highly variable based on age, so Wisconsin’s per case death rate has dropped as the majority of cases are in young people. But the total number of cases has spiked, leading the daily death total to climb substantially from where it was a month ago.