
NAEP Test Results Bad News for MPS
They’ve also gone down for the state. How can we do better?

Milwaukee Public Schools Office of School Administration, 5225 W. Vliet St. Photo courtesy of Milwaukee Public Schools.
Every two years, the National Assessment of Educational Progress (NAEP) issues results for tests of 4th and 8th grade reading and mathematics for the nation and each of the states. (By NAEP’s accounting, states include the District of Columbia and the military’s school system.)
Starting in 2002, several large city school systems joined the NAEP program. Their number is currently 27. Milwaukee Public Schools (MPS) joined NAEP testing in 2009 and, aside from skipping the 2015 round, has participated since.
The chart below shows average 4th grade reading scores over the years for several groups of 4th graders: nationally (in blue), in Wisconsin (in green), for the 27 large city school systems (in red), and MPS (in yellow). The NAEP Data Explorer allows one to examine the data in various formats.
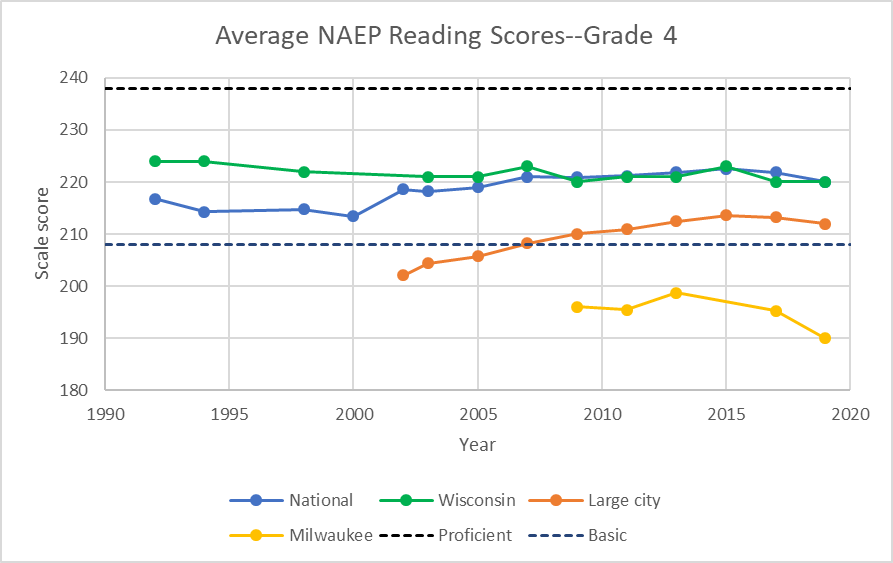
Average NAEP Reading Scores–Grade 4
The NAEP results are based on a random sample of students. For example, 3,500 of 61,000 Wisconsin 4th graders took the test; in Milwaukee, 1,200 out of 6,000 students were randomly selected. Since the results are not associated with any school or teacher, there is little pressure to inflate the scores.
Each test taker receives a scale score reflecting the difficulty of the questions successfully answered. The vertical scale on the graph above shows the average scale scores—the higher the better.
In addition, NAEP converts the scale scores into four proficiency levels. A student scoring above the top dotted line on the chart would be rated “Proficient.” Scoring between the two dotted lines would lead to a “Basic” reading score. Those below the bottom line are “Below Basic.” Not shown is a fourth proficiency level: “Advanced.”
In the case of 4th graders, this would be applied to students scoring above 268. NAEP insists that equating Proficient with “grade level” is a mistake. Although NAEP decline to rule on what constitutes grade level, others suggest that Basic is closer to the mark.
Nationally, 4th grade reading scores grew sharply starting in the year 2000 and continued growing until 2015, but at a slowing rate. However, the last two years have shown a statistically significant decline.As shown in the graph above, Wisconsin 4th grade reading scores started well above the national average. However, they did not see the same growth as elsewhere. Starting around 2009, they have closely followed the national averages, including a similar decline in the most recent NAEP.
As a group, large city schools have seen a substantial rise in their scores. At least until the last two NAEP tests, the gap between their students’ scores and national scores was closing.
MPS 4th grade students’ average reading scores puts them well Below Basic. The 6-point drop between 2017 and 2019 is statistically significant. Only Detroit scores lower.
The next graph shows the history of the 8th grade NEAP reading scores nationally and for Wisconsin, large city schools, and MPS. In every case, the scores declined on the most recent test. Wisconsin students did maintain their advantage over those nationally.
As with 4th graders, only Detroit’s 8th graders score lower than the MPS average. The 5-point drop from 2017 is statistically significant.
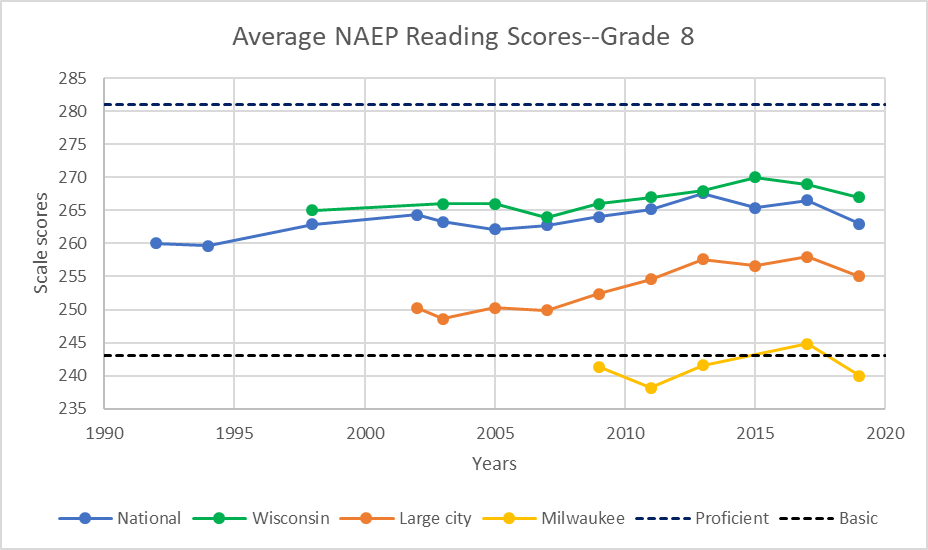
Average NAEP Reading Scores–Grade 8
The next graph shows the results for 4th grade math. Over the long run, the U.S. has seen more progress in math than in reading. It appears that there was something of a recovery in the latest NAEP results. Unfortunately, MPS did not share in the recent gain.

Average NAEP Math Scores–Grade 4
The next graph shows the average scores in 8th grade math. Until recently all four series rose steadily. Since 2013, all four have flattened.
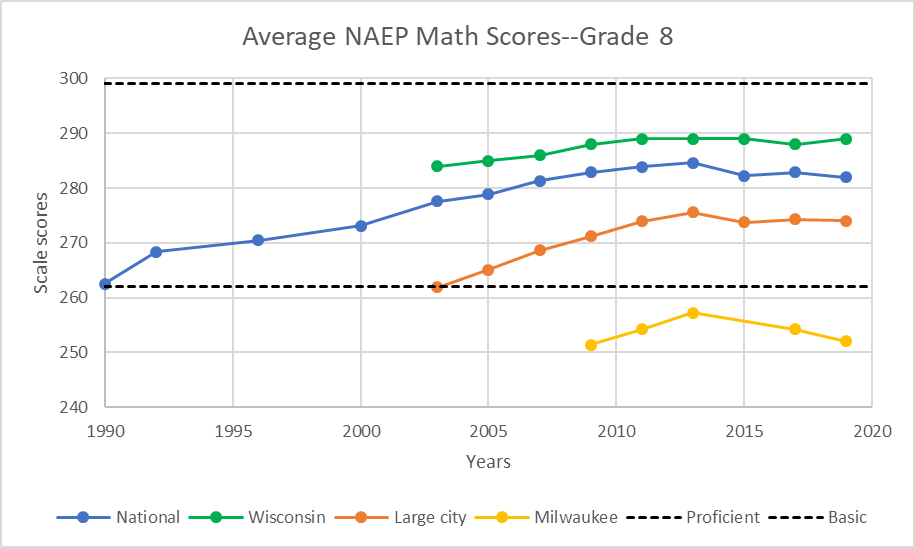
Average NAEP Math Scores–Grade 8
It is not surprising that the latest NAEP results created disappointment among those who follow education. As summarized in a New York Times article: “The latest Nation’s Report Card is painting a dismal picture of math and reading achievement among American fourth and eighth graders despite a few bright spots.” Two exceptions mentioned were Mississippi and the District of Columbia.
Arne Duncan published a column in the Washington Post saying “The latest results from the National Assessment of Educational Progress (NAEP) are prompting some soul-searching about the limited gains over the past decade, but there are outliers worth saluting.” In addition to mentioning Mississippi and Washington, DC, he pointed to Louisiana and Tennessee. On the district level, Duncan pointed to Denver and Cleveland.
The Fordham Foundation’s Mike Petrilli commented that “it wasn’t hard to predict that this year’s results from the National Assessment of Educational Progress would be bleak. With the lingering effects of the Great Recession … though, it turned out to be eighth grade where the news was most dismaying.”
A Chalkbeat article pointed to “another troubling trend: While the nation’s highest-achieving students are doing better in both subjects than they were 10 years ago, the lowest-performing students have been losing ground.”
Closer to home, Alan Borsuk wrote for the Journal Sentinel that “There were a few bright spots. Wisconsin was not one of them.” Borsuk lists a few solutions. As usual, his list is thoughtful, but unlikely to happen so long as the energy around MPS is to fight school choice and charters and to denounce standardized testing. But if we don’t measure, how can we expect to improve student outcomes?
Milwaukee education needs a dose of pragmatism. Are there elements common to the states and districts that achieved improved results? This brings up one of the challenges of education research: isolating the effects of a strategy. Often the approach is to identify the strategies adopted by the states with outstanding results and suggest that others follow suit. Often left unexamined is whether similar strategies were adopted by their peers but without the same results. So far as I know, we simply do not have the data that allows us to do that kind of analysis.Consider, instead, an organization I had never heard of previously. Called Chiefs for Change, its 41 members are current or former heads of state education agencies or school districts. Its history almost guarantees opposition from a certain faction of the left. Formed by former Florida governor Jeb Bush to promote many of his K-12 education policies, it split from Bush’s foundation in 2015. One aim for the split was to make it nonpartisan. Judging from the membership, this goal was achieved—neither Denver nor Washington, DC, for instance, are considered hotbeds of Trumpism. But its history is sufficient to provoke periodic attacks (see here, here, here, and here for examples). None of the members are from Milwaukee or anywhere in Wisconsin.
To explore whether there was a relationship between membership in CFC and student outcomes, I calculated the total gain or loss over the scores on the 4th and 8th grade reading and math tests for each of the states between 2017 and 2019. As the chart below shows, scores for states whose chief education officer is a member of CFC (shown in navy blue) were clustered at the top.
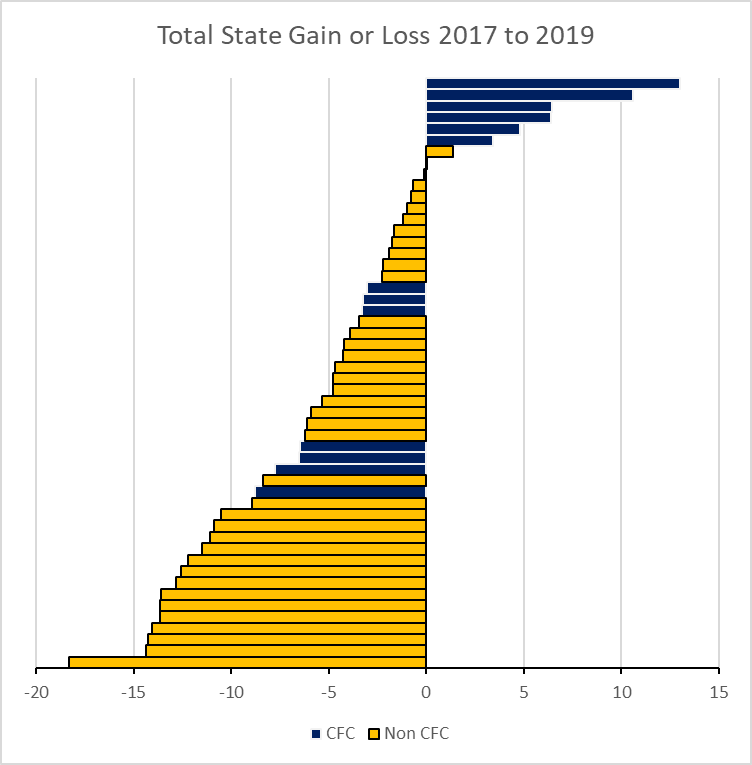
Total State Gain or Loss 2017 to 2019
The next chart shows the results for school districts. CFC membership was counted if it was at either the district or state level.
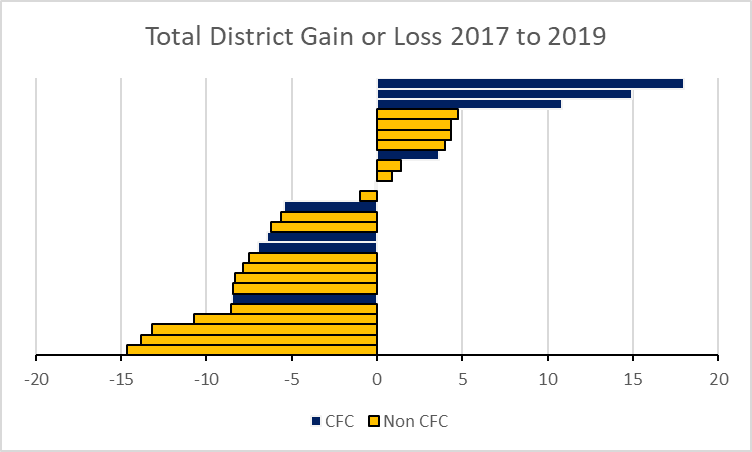
Total District Gain or Loss 2017 to 2019
The next chart summarizes to two preceding charts. Between 2017 and 2019, the average state lost a total of five points and the average district lost 2.5. By comparison, states without members lost an average of 6.8 points, compared to a gain of .4 for those with a member. Districts with members gained 2.2 points, compared to a loss of 4.8 for those without.
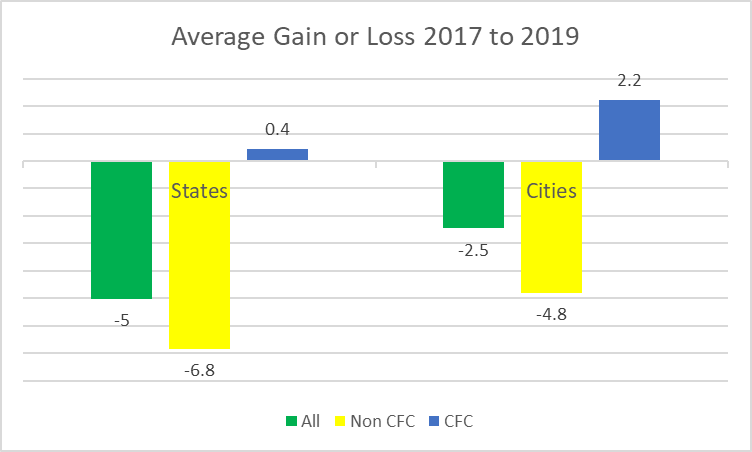
Average Gain or Loss 2017 to 2019
At this point, it is near-mandatory to stress that correlation does not prove causation. There could be other explanations for the pattern, ranging from random effects to targeted recruitment of heads of successful school systems.
However, there are reasons to think there is a causal relationship. One cannot be around American education for long without noticing how little useful transfer of knowledge goes on between heads of successful schools and districts and those who are struggling.
Data Wonk
-
Who Do You Trust to Conduct Elections Fairly?
 Apr 6th, 2026 by Bruce Thompson
-
Is Non-Citizen Voting a Real Threat to Elections in Wisconsin?
Mar 18th, 2026 by Bruce Thompson
-
How Global Climate Change Affects Milwaukee
 Mar 11th, 2026 by Bruce Thompson


This article is another excellent examination of data by Bruce Thompson. One possible reason for the lack of improvement in some districts could be that districts are always chasing some new curricular approach to teach reading and math when teachers are still trying to learn how to teach the last “miracle” program. School reform today is not about improving education but about political control of governance and what is taught. Chiefs for Change are just another conservative political group focused on promoting political projects like school choice and charters.