
Has Walker Shrunk Wisconsin’s Economy?
Both Barca and Trump blame him. But what does the data show? Second in series.
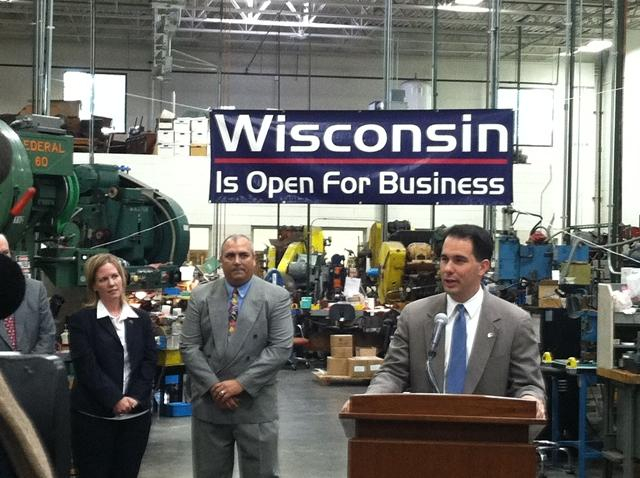
Gov. Scott Walker. Photo from the State of Wisconsin.
A recent Data Wonk column asked whether Scott Walker’s policies helped the Wisconsin economy. The data, I found, did not support that conclusion. Nor did other states adopting Walker-like policies enjoy the prosperity that was promised.
Can the question be reversed? If Walker’s policies haven’t helped the Wisconsin economy, does that mean they were harmful? In a recent Urban Milwaukee op-ed, Peter Barca made that very argument. That, of course, is part of his job, as Democratic minority leader in the Wisconsin Assembly.
Barca lists a number of statistics that reflect poorly on the Wisconsin economy (layoff notices, lagging job growth, and a shrinking middle class). He then lists a number of initiatives coming from Walker and his Republican allies (cuts to K-12 education, cuts to the UW system, rejecting money for Medicaid expansion, the attacks on open records). Even if one agrees that many of Walker’s initiatives were unwise—and I do—it’s very hard to demonstrate a causal relationship between the policies and a lagging economy.
Before exploring the question of causality, let’s turn to the question of fairness. Is it “fair” for Barca—or Donald Trump in the Republican debates–to blame Walker for Wisconsin’s mediocre economic performance? By the standards Walker had already set, blaming the lagging economy on him is perfectly fair.
Throughout his campaign for governor, Walker blamed his predecessor, Democratic Gov. Jim Doyle, for Wisconsin’s lagging jobs, ignoring the effects of the Great Recession. In his re-election campaign he blamed Mary Burke for job growth below the national economy while she was Commerce Secretary. When, early in his term a jobs report was released showing Wisconsin leading the nation Walker was quick to take credit. When the preliminary figures turned out to be incorrect, he attacked the US Labor Department and demanded it change its method of counting jobs. And, he promised to create 250,000 new jobs in his first term, about twice the actual number that was achieved.
If the question is not fairness but accuracy, however, the answer becomes more elusive. Traditionally the starting point in establishing causality is developing a hypothesis. Actually, the hypothesis consists of two parts: a “null hypothesis” and an “alternative hypothesis” in case the null hypothesis is rejected. Basically the null hypothesis says that nothing has changed—with a new medicine a cold lasts about as long as without it or students learn math about as well with a new book as they did before. The alternative hypothesis says something is different: the cold is over sooner or the students learns more (or less) math with the new book.
To test the hypothesis, ideally a large number of cold sufferers or math students are randomly split between those getting the new treatment and those with the traditional treatment (chicken soup or the old math book perhaps). If a difference does show up, how likely does it reflect the effect of the treatments versus possible differences in the samples? This leads to estimates of the likelihood that the apparent difference could be due to sample difference, such as the familiar 95 percent confidence level, meaning there is a 5 percent probability the apparent difference is due to sampling error.When trying to measure the effects of state policies on the economy, however, there are a number of obstacles in applying the ideal model described above. No legislature is likely to cooperate with any attempt to randomly select states to implement a particular policy. States, moreover, vary in all sorts of ways and it is very difficult to isolate the effect of a single policy. There is no good way to test the “counter-factual”—how would Wisconsin’s economy differ with a Democratic governor?
There is likely bias in any sample. Increasingly Southern states elect Republicans and those on the east and west coasts Democrats. Are differences between their performances an accident of geography and history or due to differing public policies?
In Wisconsin’s case, it is not possible to confidently say that the difference in economic performance between Wisconsin and its neighbors results from government policy and not some other factor. For example, Wisconsin’s neighbors Minnesota and Michigan have both added more jobs than Wisconsin over the past five years. But Minnesota’s performance has been credited to having both the major university and the state capital in its major metropolis and a business community that is more innovative.
Michigan’s superior job growth, on the other hand, is generally credited to the automobile industry’s recovery from the Great Recession. It should be noted that, while credible, the two explanations operate in opposite directions: Minnesota is doing well because it previously did well; Michigan is doing well because it previously did badly.
Comparing states depends heavily on the choice of both states and of time periods. In the previous column I compared the job growth of the eight states whose governors’ policies were most admired by the libertarian Cato Institute, to eight other states that Cato gave grades of “F.” As it turns out, the average job growth since the start of 2011 was substantially greater in states given “F”s by Cato than in states given the best grades and the difference was statistically significant.
This period corresponds to the time Walker has been in office—a time of recovery from the Great Recession. What about the Great Recession itself? The next two charts show the job change over this period, basically the four years before Walker took office. In this case, Cato’s preferred states did slightly better, losing 3.4 percent of jobs versus 4.3 percent for the states it gave an “F.” The difference, however, is not statistically significant.
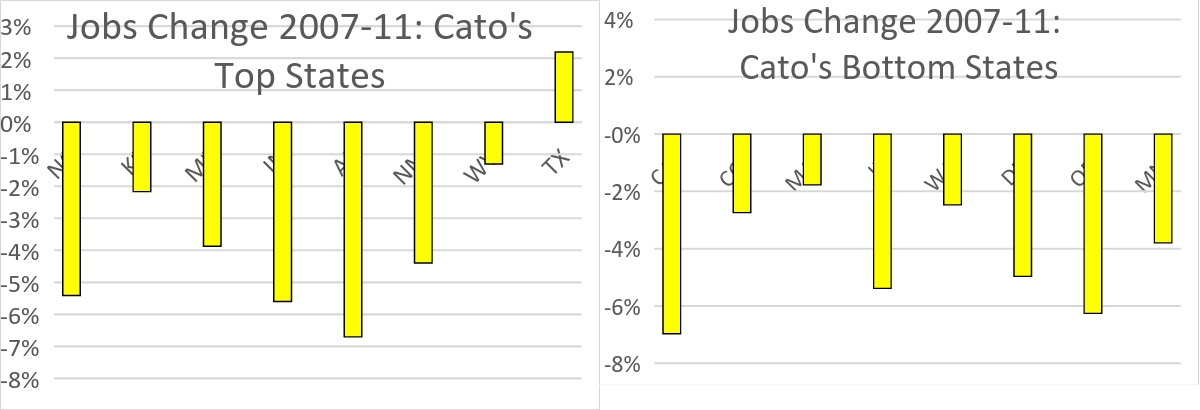
Jobs Change 2007-11
For the past two decades, Wisconsin’s share of American jobs has pretty steadily declined as shown in the graph below. During the period, four different governors were in office. Is it fair to hold them responsible?
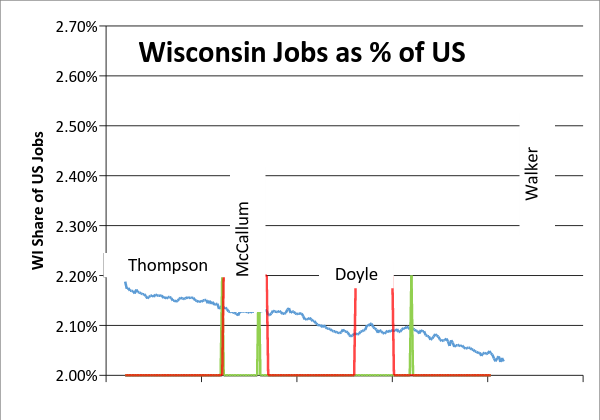
Wisconsin Jobs as % of US
In the graph, the green lines mark the transition between governors of each party. The red lines mark the two periods when employment nationally—and in Wisconsin–was shrinking.
Starting midway through the Tommy Thompson administration Wisconsin’s share of national jobs started shrinking. It paused briefly during the dotcom bust of the early 2000 decade, only to resume dropping again once recovery was well under way. With the start of the Great Recession, the same pattern was repeated: if anything, Wisconsin lost jobs more slowly than the US as a whole, held its own in the first year of the recovery, only to resume the pattern of lagging the national economy as the recovery got under way.
Ignoring who was governor–and when–one possible way to describe the pattern is this: In good times, Wisconsin’s economy grows less rapidly than does the national economy, a fate it shares with most other states in the Midwest and Northeast. When times get tough, however, it appears that Wisconsin employers may be more reluctant to lay off employees than those in other states.
The generally steady decline in the state’s percent of national jobs over the last 20 years is certainly cause for concern. But it is also liberating. It suggests the state’s economic performance is occurring independently of whatever policies the governors have pursued.
So rather than argue about whether policies help or hurt the state economy and job growth, this frees us to look at whether they make Wisconsin a more or less desirable place to live. If states are increasingly competing on the basis of lifestyle perhaps this is also be the best policy for economic health.
Data Wonk
-
Who Do You Trust to Conduct Elections Fairly?
 Apr 6th, 2026 by Bruce Thompson
-
Is Non-Citizen Voting a Real Threat to Elections in Wisconsin?
Mar 18th, 2026 by Bruce Thompson
-
How Global Climate Change Affects Milwaukee
 Mar 11th, 2026 by Bruce Thompson


Walker’s Wisconsin (and Sam Brownback’s Kansas) are laboratory cases of what happens when Tea Party extremists have a choke hold on all branches of government. To the rest of the nation, it’s ugly and scary–believe me, I travel a lot. Business owners don’t want to relocate to states run by crazy people who despise the educated.
While the decline of manufacturing accounts for Wisconsin’s declining share of jobs, Gov. Walker could have easily reversed the trend and set Wisconsin’s economy growing again by not killing the high speed train from Milwaukee to Madison. If you look at Minnesota, Michigan, and every other growing state (WA, CO, OR, CA, NY, etc) they are creating light rail and passenger train routes. Trains keep and attract Gen Y and educated workers, and the knowledge industries that are now critical to our economy.
William, I have reservations about your assertion: “If you look at Minnesota, Michigan, and every other growing state (WA, CO, OR, CA, NY, etc) they are creating light rail and passenger train routes.” Assuming this means “growing” in an economic sense, I wondered if these were indeed leading states in economic growth.
I quickly found six different rankings of states in economic growth measures — not all consistent in terms of the data used, of course, but all fairly current (2014 and later). I noted the top 12 states in three of them, two others just showed the top 10, and one had a list of 11 high growth states. Lists were: CNN Money, Business Insider, Daily Finance, Wall Street Journal, Huffington Post (reciting data from 24/7 Wall Street), and CBS Market Watch.
Twelve states showed up on 3 or more of these “top” lists: Utah was on all 6 lists. Texas and Washington were on 5 lists. Florida, Colorado, and North Dakota were on 4. West Virginia, Idaho, South Dakota, Nevada, California and Oregon were on 3. Two of your listed states (Michigan and New York showed up on just one of the six lists, in 6th and 8th place respectively … and Minnesota was not on any of them.
Offhand I’m not aware of significant rail initiatives in places like Utah, Texas, Florida, North and South Dakota, West Virginia, Idaho, or Nevada. And since you are citing California, well, I’m not sure that rail fiasco counts for much as it stands. So, what are you using as your pecking order of “growing” states.
You also say, “Trains keep and attract Gen Y and educated workers, and the knowledge industries that are now critical to our economy.” Really? I’ve heard that point made before, but more as an article of faith than as a demonstrabl fact. My grandchildren and the spouse of the married one are in this cohort: a structural engineer, a computer assisted industrial design specialist, an accounting-trained numbers person now working extensively with computers in the distribution field, and the owner of a photography business in Milwaukee and Chicago. They are all very career-focused. A number of their their college friends (living in Milwaukee and elsewhere) are also in that demographic. Not once has the subject of trains, light rail, trolleys, etc. ever come up in conversation. They like their Uber and they love their cars. So what’s behind your opinion that trains are a significant “draw” for Gen Y and Millennials?
Wisconsin has the worst economic growth in the Midwest in the last 5 years according to the Philadelphia Fed. If it’s not Walker/WisGOP policies, care to explain why everyone else in our part of the country is beating us?
http://jakehasablog.blogspot.com/2016/02/wisconsin-economic-failures-get-some.html
I’m just glad I saved $4 on my tax bill this year.
Of course, my take home pay has been stagnant for the last six years, but at least I’m getting a great deal on taxes.
Oh yeah, and now my wife can wear blaze pink. ‘Cuz she’s a girl. And girls dig pink.
Without getting into whether rail attracts certain (desirable) demographics, it is worth noting that CA, FL, TX, and UT all have various forms of passenger rail service (intercity, regional/commuter, urban [heavy rail/light rail/streetcar]) in place or under construction.
CA: Many, many rail projects under construction or in study phases, as well as sizable transit networks in Los Angeles, Sacramento, San Diego, San Francisco/Oakland, and San Jose
FL: Brightline, an intercity passenger rail service linking Miami, Fort Lauderdale, West Palm Beach, and Orlando, has begun construction. The Orlando metro area has recently added a commuter rail line and is planning to extend that line and perhaps add some form of urban transit as well. There are other rail transit systems in the Miami-Fort Lauderdale-West Palm Beach area, with extensions or additions under study, as well as small lines in Jacksonville and Tampa.
TX: The Dallas/Fort Worth metro area has a large light rail system that has undergone significant expansion in recent years, as well as a small streetcar network in Dallas and a commuter rail line linking the 2 major cities, plus other lines in planning or under construction. Houston has recently opened 2 additional light rail lines. And there is a Japanese-led effort to build a high speed rail line between Dallas and Houston.
UT: The Salt Lake City metro area has a fairly new, fairly large commuter rail and light rail system, as well as a streetcar line.
Thanks, Eric S. Very helpful information. Is there a website you have found to be reliable for updates on what’s going on across the country re: passenger rail in urban areas?
Terry, thanks for thinking about the connection between economic prosperity and trains. First, if you look at cities in those states, you will see Gen Y flocking to cities with light rail and trains – – Seattle, Portland, San Francisco, San Diego, Chicago, New York, DC, etc. For example, Marriott just moved its HQ to be on the Red Line in DC, and said it was to attract Gen Y workers. I live in Wisconsin, but just ten miles from the Twin Cities, and it is night-and-day difference, with the Twin Cities attracting many of our kids, having higher salaries, and of course building lots of light rail. The light rail lines hit ridership targets years before Mndot estimates. The data shows that Gen Y is the primary force behind Amtrak’s almost annual record in ridership. For these cities attracting Gen Y, see Enrico Moretti’s The New Geography of Jobs (Forbes rated it the top book of the year) for the data. Thanks for prompting this great discussion on the link between the economy and trains Terry.
Terry and Eric, I have Google Alerts for “trains” and “light rail.” Then I would join for $0 to max $15 one group like West Central Wisconsin Rail Coalition (Eau Claire, free), Wisconsin Assn. of Railroad Passengers (WisARP), Milwaukee chapter of WisARP or Pro-Rail (Madison), Midwest High Speed Rail Assn (Chicago), or National Assn. of Rail Passengers. They all link to each other and other stories, so you join one and you’ll get info, news and links to other sites all over the map. Eric, you are current on all this, what are your sources?
Unfortunately I don’t have a single site to recommend. I’ve been following these developments for a long time, it’s something that has always interested me, so I’ve picked up a lot along the way and I check all sorts of websites and read a few publications that interest me. I can just list off the top of my head the American and Canadian metro areas that have commuter rail, heavy rail, light rail, streetcar, and other rail transit systems.
But if you’re just looking for information about existing urban/suburban/regional rail systems, a quick/easy reference is wikipedia (look up articles on commuter rail, light rail, rapid transit, and perhaps streetcars) – not that wikipedia is always a reliable source, but it should give you links to the websites of these various transit systems and agencies.
The best website for unbiased transit data is the “National Transit Database” which is compiled by the US Dept of Transportation. Every transit agency receiving federal funds must submit data which is then reported, city-by-city, in a consistent format. They also have some national summaries allowing you to compare things like cost, ridership, and vehicle life by mode (bus vs steetcar vs light rail vs commuter rail, etc)
Download the latest “Profile Archives” (on the right side of this page):
http://www.ntdprogram.gov/ntdprogram/archives.htm
The “Top 30/50 Profile Archives” (also on the right of that page, and which, starting in 2002 covers the biggest 50 systems—including Milwaukee; before 2002 they only covered the largest 30—excluding Milwaukee) is a smaller download.
The story I’ve heard is that the NTD was established by Congressional Republicans that hoped to show that rail was a boondoggle that cost more than buses. It backfired on them—proving the exact opposite.
I’d agree with Tom D about the NTD – if you’re looking for facts and figures, especially to compare different transit agencies, it’s hard to beat.
If you’re just looking for ridership numbers, the American Public Transportation Association puts out a quarterly report, available at: http://www.apta.com/resources/statistics/Pages/ridershipreport.aspx
The APTA data seems spotty. In Wisconsin, for example, they only list 3 bus systems: Milwaukee, Madison, and Racine, while ignoring places like Kenosha, Beloit, & Janesville. (They also list on-demand service in Pt Washington).
In the NYC area, they omit the two biggest bus suburban bus systems: Nassau County and Westchester County—each of which is among the 50 largest bus systems in the USA.
In Manitoba, Canada, they only list Brandon (population 46,000) while ignoring Winnipeg (population 663,000).
Is it possible that APTA only includes systems that pay for membership??
You’re right, it is spotty – some not insignificant systems are left off. Whether it’s related to membership, or perhaps relies on voluntary reporting, I have no idea. It does seem to vary from quarter to quarter and year to year.
As a quick reference for most major systems, I think it’s a bit easier to access than the data in the NTD, especially if you’re just looking for rail info. But I should have mentioned the caveats you noted.