
December Home Sales Up 1.5%
2017 Sales Up 1.7%
Houses on Astor. Photo by Carl Baehr.
Market Highlights
- 2017 Was Best Sales Year Since 2005
- Listings Desperately Low
- Metro Prices Finally Surpass 2007 Peak
| County | December Sales | %
Change |
|
| 2016 | 2017 | ||
| Milwaukee | 749 | 779 | 4.0% |
| Waukesha | 417 | 393 | -5.8% |
| Washington | 125 | 123 | -1.6% |
| Ozaukee | 80 | 97 | 21.3% |
| 4 County Area | 1,371 | 1,392 | 1.5% |
January 15, 2018 – Home sales were up 1.5% (21 units) in December in the Metropolitan Milwaukee market over the same period in 2016. It was the 9th month of 2017 with positive sales, and the strongest December for sales since 2004.
1,392 homes sold in December compared to 1,371 in December of 2016. Comparing the numbers to December 2015, sales were up 0.5% (1,385 in ‘15).
| County | 2017 Year-End Sales | %
Change |
|
| 2016 | 2017 | ||
| Milwaukee | 11,544 | 11,828 | 2.5% |
| Waukesha | 6,038 | 5,998 | -0.7% |
| Washington | 2,073 | 2,138 | 3.1% |
| Ozaukee | 1,352 | 1,393 | 3.0% |
| 4 County Area | 21,007 | 21,357 | 1.7% |
For the year, the market saw 21,357 total sales, compared to 21,007 in 2016, a 1.7% increase. 2017 was 8.9% ahead of 2015 when there were 19,611 unit sales.
2017’s total sales were the highest annual total since 2005, when there were 21,642 unit sales.
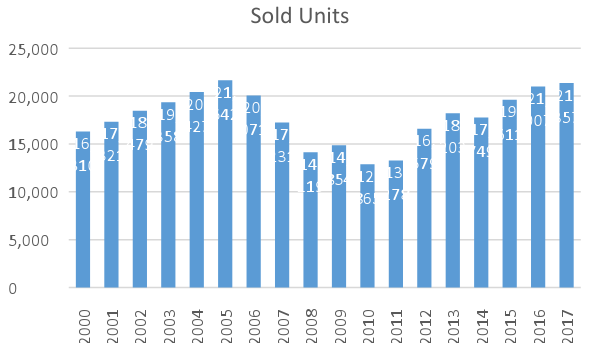
Sold Units
The deepest point of the Great Recession in real estate was in 2010, when only 12,865 units were sold.
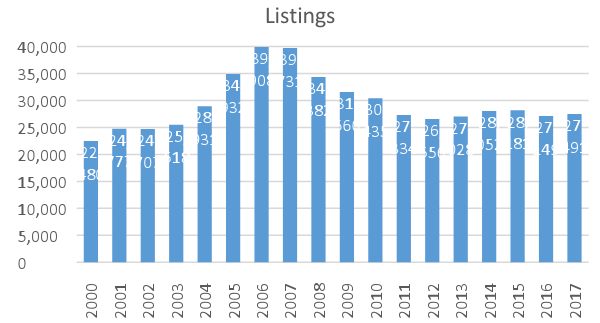
Listings
| County | 2017 Year-End Listings | %
Change |
|
| 2016 | 2017 | ||
| Milwaukee | 15,373 | 15,754 | 2.5% |
| Waukesha | 7,632 | 7,381 | -3.3% |
| Washington | 2,511 | 2,590 | 3.1% |
| Ozaukee | 1,633 | 1,766 | 8.1% |
| 4 County Area | 27,149 | 27,491 | 1.3% |
Surprisingly, 2017 finished 1.3% ahead of 2016 in properties listed for sale. The 27,491 units listed, was 342 more than in 2016, a year also characterized by low inventory.
| County | December Listings | %
Change |
|
| 2016 | 2017 | ||
| Milwaukee | 560 | 566 | 1.1% |
| Waukesha | 195 | 188 | -3.6% |
| Washington | 62 | 63 | 1.6% |
| Ozaukee | 41 | 56 | 36.6% |
| 4 County Area | 858 | 873 | 1.7% |
December was only the 5th month of 2017 with an increase in listings, and only the 13th month since the beginning of 2015 in positive territory.
The 858 listings in December of 2016 was the lowest December in the 21st Century. December 2017, the second lowest this century, only beat 2016 by 15 listings.
The highest period for listings in the greater Milwaukee market was in 2006 and 2007, the years just before the Great Recession hit.
Inventory Tight
The seasonally adjusted inventory level for December was 3.2 months, a drop from November’s 3.9 month level. The seasonally adjusted level was 3.8 months in December 2016.
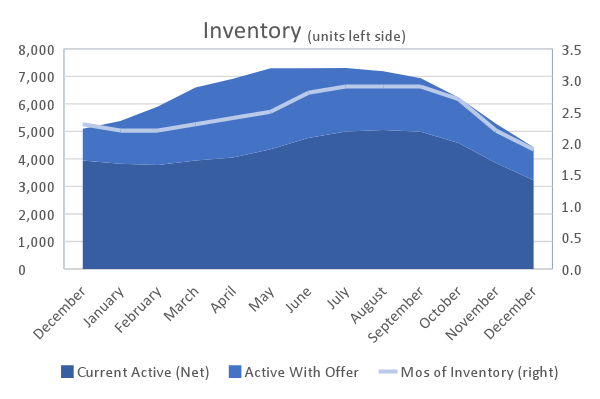
Inventory (units left side)
Subtracting the 1,197 listings with an active offer from current listings presents an effective inventory level of 1.9 months, down from November’s 2.2 month level. A year ago, the same calculation showed December’s inventory level at 2.3 months.
Throughout the year, brokers have been saying they cannot recall a time when inventory was this tight.
Average Sale Prices
| County | Average Sale Price | $
Change |
%
Change |
||
| 2016 | 2017 | ||||
| Milwaukee | $168,319 | $176,012 | $7,693 | 4.6% | |
| Waukesha | $303,503 | $321,224 | $17,721 | 5.8% | |
| Washington | $228,661 | $236,807 | $8,146 | 3.6% | |
| Ozaukee | $310,036 | $331,171 | $21,135 | 6.8% | |
The average sale price in all four counties was up in 2017 compared to 2016.
Ozaukee County led the way with a $21,135 gain.
The 4 County area has finally eclipsed the highest average sale price recorded prior to the market crash in 2008. The average sales price for 2017 was $266,304, 1.9% more than the $261,280 in 2007.
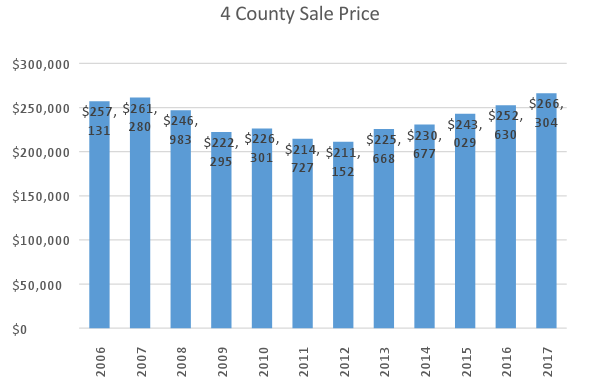
4 County Sale Price
The market had been creeping back to the peak price point in recent years. 2016 lagged behind 2007 by 3.3%, and 2015 was 7.0% behind.
| County | Recovery Since Peak | $
Change |
%
Change |
||
| 2007 | 2017 | ||||
| Milwaukee | $192,844 | $176,012 | -$16,832 | -8.7% | |
| Waukesha | $310,688 | $321,224 | $10,536 | 3.4% | |
| Washington | $231,052 | $236,807 | $5,755 | 2.5% | |
| Ozaukee | $315,871 | $331,171 | $15,300 | 6.6% | |
Since peak prices were set prior to the Great Recession, every county, except Milwaukee, has exceeded its high water mark.
Milwaukee County’s gap is due to the volume and diversity of housing units in the City of Milwaukee, and hard hit neighborhoods on the north side of the city where values plummeted. It will probably take 2 more years for the city to bounce back.
Hottest Markets
The most active markets in the region, characterized by those communities with more than 75 unit sales, that had an increase in units sold and average sale price, and a decrease in days-on-market (DOM):
| Community | Change in Units Sold | Change in Sale Price | % Sale Price Change | Change in DOM |
| Bayside | 1% | $11,717 | 4% | -39% |
| Brookfield | 3% | $27,214 | 9% | -10% |
| Brown Deer | 14% | $14,209 | 11% | -26% |
| Cudahy | 3% | $8,483 | 7% | -33% |
| Elm Grove | 18% | $74,053 | 19% | -33% |
| Genesee | 21% | $18,498 | 5% | -40% |
| Germantown | 8% | $130 | 0.1% | -30% |
| Glendale | 0.4% | $951 | 1% | -32% |
| Grafton | 6% | $9,134 | 4% | -30% |
| Greenfield | 4% | $20,106 | 12% | -25% |
| Hales Corners | 43% | $26,844 | 13% | -30% |
| Hartford | 19% | $19,576 | 10% | -33% |
| Jackson | 3% | $9,355 | 4% | -41% |
| Kewaskum | 11% | $26,351 | 15% | -40% |
| Menomonee Falls | 5% | $19,109 | 7% | -26% |
| Mequon | 9% | $24,434 | 5% | -37% |
| Milwaukee | 5% | $9,355 | 7% | -25% |
| So. Milwaukee | 1% | $18,169 | 13% | -33% |
| Wauwatosa | 2% | $16,904 | 7% | -33% |
| West Allis | 1% | $9,236 | 7% | -29% |
| West Bend | 2% | $1,744 | 1% | -29% |
Where to go
Buyers should seek the counsel of a REALTOR® in determining their best housing options, and sellers need a REALTORS® expert advice in making correct marketing decisions with their home.
The Greater Milwaukee Association of REALTORS® is a 4,000-member strong professional organization dedicated to providing information, services and products to “help REALTORS® help their clients” buy and sell real estate. Data for this report was collected by Metro MLS, Inc. a wholly-owned subsidiary of the GMAR.
* Sales and Listing figures differ between the “Monthly Stats” and “4th qtr” (or year-end) because the collection of “Monthly Stats” ends on the 10th of each month; whereas the “4th qtr” is a continuous tally to 12/31. For example, if a sale occurred on July 29th, but the agent does not record the sale until August 11th, that sale would not be included in the July sales figures (or any subsequent month’s total) but would be added to the annual total sales figure in the “4th qtr” total.
NOTE: This press release was submitted to Urban Milwaukee and was not written by an Urban Milwaukee writer. While it is believed to be reliable, Urban Milwaukee does not guarantee its accuracy or completeness.
Mentioned in This Press Release
Recent Press Releases by Greater Milwaukee Association of REALTORS®


Inspiration Takes Root at the 2025 REALTORS® Home & Garden Show, March 21 – 30 at the Expo Center at Wisconsin State Fair Park
Jan 20th, 2025 by Greater Milwaukee Association of REALTORS®99th annual show to offer tips and trends in landscaping, gardening, home improvements, interior design and more.