
Did Trump Oversee The Best Economy in History?
The data for Wisconsin and nation offers a less euphoric conclusion.

Donald Trump delivers 2024 RNC speech. Photo by Jeramey Jannene.
In his speech to the Republican National Convention, former President Donald Trump claimed several times to have created the best economy ever in his previous term as president:
… we had an economy the likes of which nobody, no nation had ever seen.
Later, he returned to the same theme:
… the best economy in the history of our country, in the history of the world. …
Once again:
We had the greatest economy in the history of the world. We had never done anything like it.
But Trump failed to provide any evidence for his claim. In this column, I take a look at four historical measures that can be used to assess the state of the economy: the growth of private sector jobs, the gross domestic product (GDP), manufacturing jobs, and the unemployment rate. For each of these measures I look at the data for both Wisconsin and for the United States as a whole.
The data are based on surveys by the U.S. Bureau of Labor Statistics (jobs and unemployment) and the U.S. Bureau of Economic Analysis (GDP). The sample sizes for states are much smaller than the national samples and, therefore, more subject to random sample variation.
One caveat regarding the use of these measures is that presidents and governors are often blamed for bad economic news and credited for good news that they may have little to do with creating. For example, oil prices are dependent on a global market. High prices are good for oil producing states like Wyoming and Texas, but bad for Wisconsin.
That said, it is possible to overdo that caveat. This danger may be particularly true for the economy in the Biden era, in which he was able to pass a number of measures that likely boosted the economy, including bills on infrastructure, on developing computer chips, and moving away from fossil fuels.
Wisconsin Jobs
The next graph shows the annual percentage of job growth (or shrinkage) in Wisconsin by president since the first President Bush.
One challenge is how to treat the year 2020, the last year of the Trump presidency and when Covid 19 hit. While Trump can be criticized for his chaotic response to the virus, this is certain to have been a difficult year even with a much more competent president.
Thus, I have treated the Trump years two different ways. The first, designated as “Trump 1” includes all four Trump years. This results in a -0.8% job loss for the Trump years.
The second excludes Trump’s last year and is designated as “Trump 2.” This results in 0.6% growth, positive, but far less than growth under Biden.
This is consistent with the argument that the economy in Trump’s first three years essentially extended the Obama recovery from the Great Recession. In this view, the slowness of the recovery reflected the need for more stimulus spending. By contrast, the Biden administration oversaw the largest job growth since Bill Clinton.
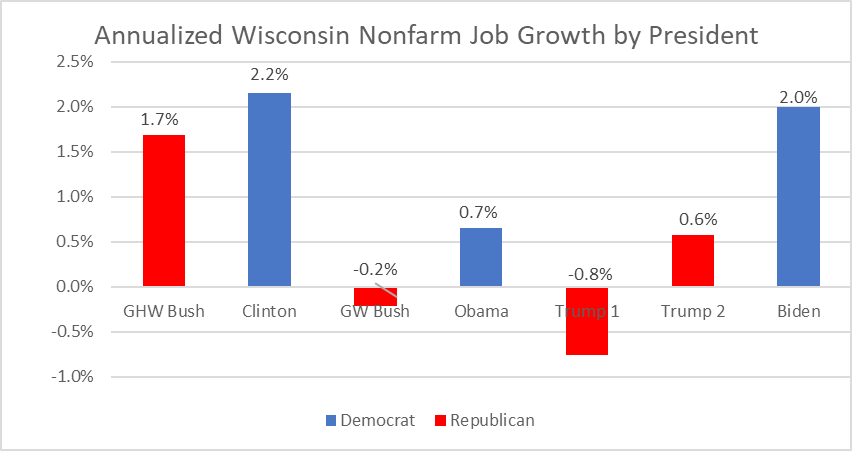
Annualized Wisconsin Nonfarm Job Growth by President. Bruce Thompson.
U.S. Job Growth
The next graph shows U.S. job growth since the end of the Second World War. Although the numbers differ somewhat from Wisconsin’s, the pattern is the same. As with Wisconsin’s, Trump’s numbers flip from negative to positive if 2020 is ignored and his average growth is half that of Biden’s. As before, Trump’s first three years look like an extension of Obama’s.
Even excluding 2020, eight of the thirteen postwar presidents had greater U.S. job growth than did Trump. This is hardly evidence of “the best economy in the history of our country, in the history of the world.” It is notable that the four presidents with the strongest job growth were all Democrats while the four with the lowest growth were Republicans.
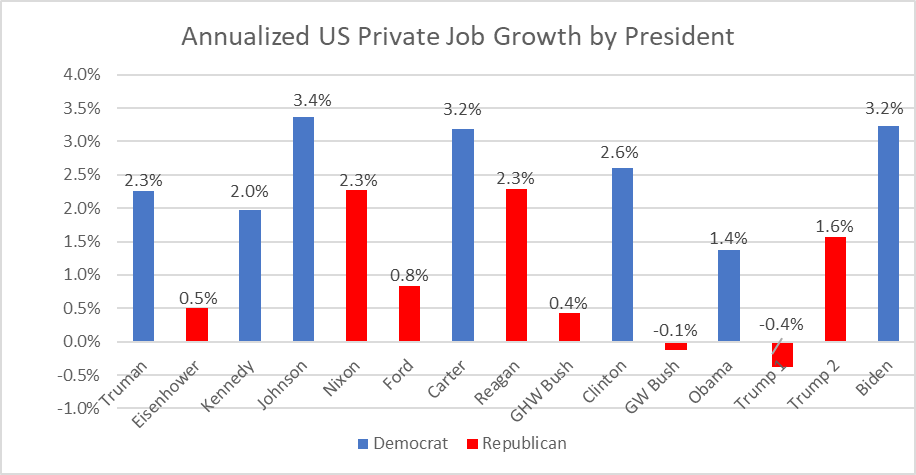
Annualized US Private Job Growth by President. Bruce Thompson.
Manufacturing Jobs In Wisconsin
The next graph shows the percentage changes in Wisconsin manufacturing jobs. Again, ignoring 2020 gives a positive change in the other three Trump years (“Trump 2”). Even so, the Trump growth is less than Biden’s.
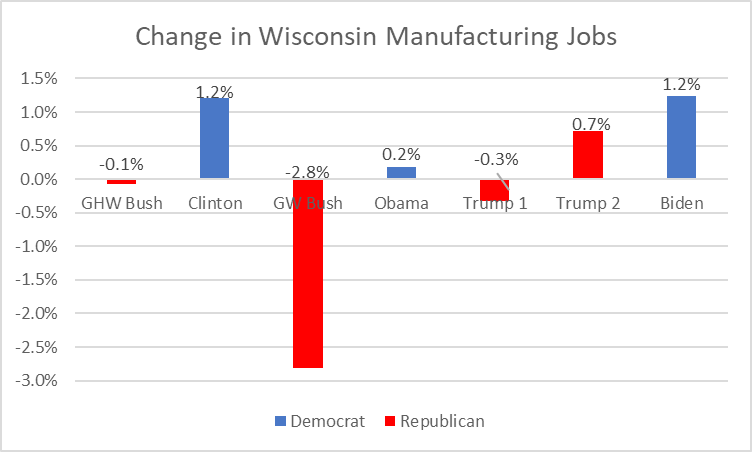
Change in Wisconsin Manufacturing Jobs. Bruce Thompson.
U.S. Manufacturing Jobs
The next graph shows the change in manufacturing jobs in the United States. Overall job growth in the immediate postwar period was followed by a long period in which the nation shed manufacturing jobs as firms looked for lower labor costs in other nations. As with Wisconsin manufacturing, ignoring 2020 causes Trump’s results to flip from negative to positive. However, even with this the growth is less than in the present Biden era.
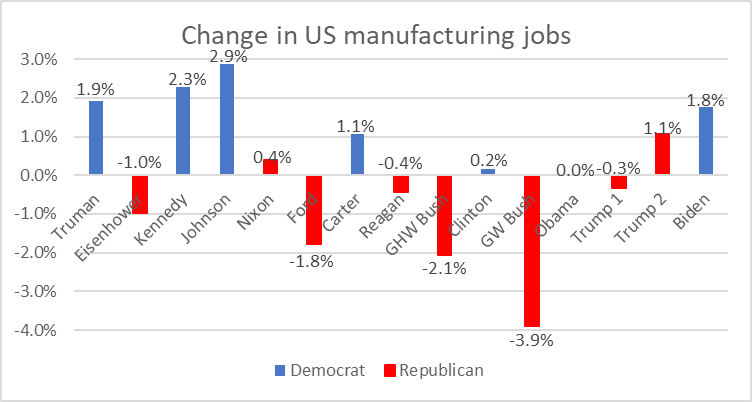
Change in U.S. Manufacturing Jobs. Bruce Thompson.
Gross Domestic Product (GDP) In Wisconsin
The next graph shows the percentage change in Wisconsin’s GDP. Biden’s results slightly exceed Trump’s with or without the 2020 data. While not a large difference, it does not support Trump’s claims in his convention speech.
Note that use of “Real” indicates that the data are adjusted for inflation.
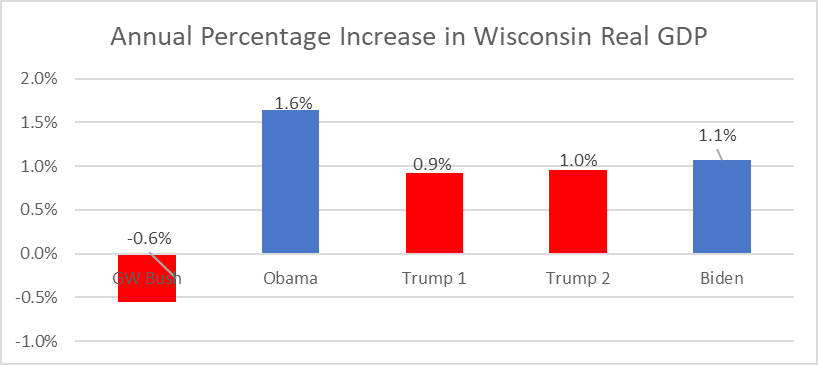
Annual Percentage Increase in Wisconsin Real GDP. Bruce Thompson.
U.S. GDP Growth
The next graph shows the average growth in GDP in the whole postwar period. Again, even taking out results for 2020, growth in GDP during the Trump years lags behind the Biden years’ growth, not to mention growth in earlier years.
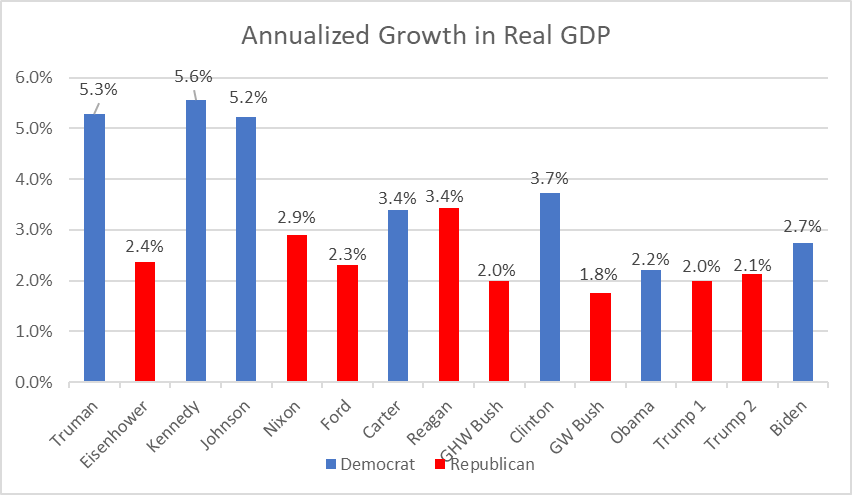
Annualized Growth in GDP. Bruce Thompson.
Unemployment Rate In Wisconsin
The next graph shows the difference between the unemployment rate at the end of each president’s term and the beginning. (In contrast to the three previous measures, a downward pointing graph is a good thing.) Again, ignoring 2020 flips Trump’s result.
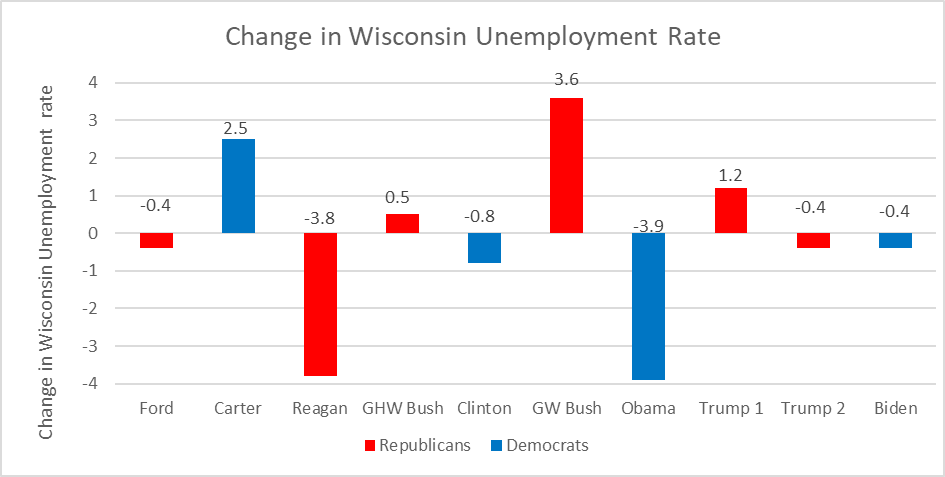
Change in Wisconsin Unemployment Rate. Bruce Thompson.
Unemployment Rate In The U.S.
The next graph shows the postwar change in the unemployment rate nationally. Excluding the year 2020 flips the direction of the Trump results from increased to decreased unemployment. However, most of the Democratic presidents, including Biden, enjoyed a greater decline in their unemployment rate.
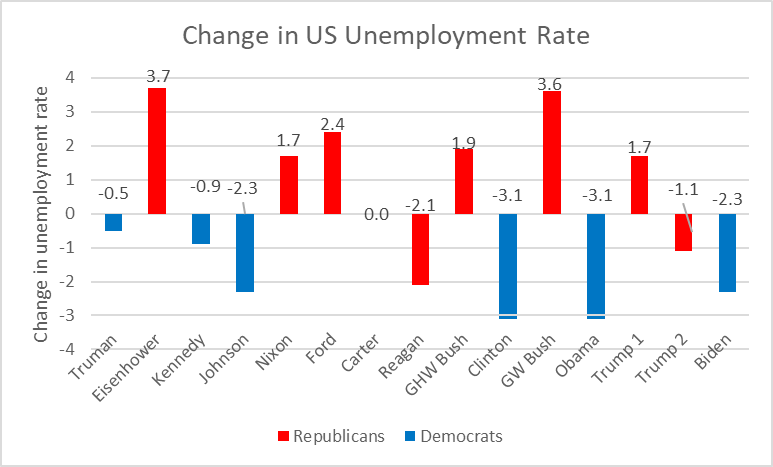
Change in U.S. Unemployment Rate. Bruce Thompson.
Trump’s claim that the U.S. had “the best economy in the history of our country, in the history of the world” while he was president is a complete fiction. The evidence suggests his economy was at best a mediocre one. Yet, if the polls are correct, it appears that half the voters believe his extraordinary claim.
What explains this? Perhaps the explanation lies in another part of the economy—that the benefits of growth in the economy have been unevenly distributed, mainly flowing to people who are already quite wealthy.
If you think stories like this are important, become a member of Urban Milwaukee and help support real, independent journalism. Plus you get some cool added benefits.
Data Wonk
-
Who Do You Trust to Conduct Elections Fairly?
 Apr 6th, 2026 by Bruce Thompson
-
Is Non-Citizen Voting a Real Threat to Elections in Wisconsin?
Mar 18th, 2026 by Bruce Thompson
-
How Global Climate Change Affects Milwaukee
 Mar 11th, 2026 by Bruce Thompson


“We had the greatest economy in the history of the world. We had never done anything like it.” – Donald Trump
But Trump failed to provide any evidence for his claim.
I appreciate all of the graphic proof. Statistics don’t lie. Frump does.