Why Voters Are Pessimistic About Economy
The economic data for state and U.S. is very positive. So why is it viewed so negatively?
File photo by Jeramey Jannene.
A recent Data Wonk column examined data on the economy which showed the current U.S. and Wisconsin economies are growing steadily stronger. Yet current opinion polls suggest the average voter has the opposite belief. Consider the graph below.
The blue line shows the Wisconsin unemployment rate, using data from the U.S. Bureau of Labor Statistics. In March 2020, the COVID-19 pandemic caused a very sharp increase in the Wisconsin unemployment rate. It jumped from 2.9% in February to 14.1% the month following, as much of the economy shut down, and since then steadily dropped to about 3% by December 2022.The yellow line summarizes responses to a repeated question on the Marquette Law poll during that same period. That question asked, “Thinking just about the state of Wisconsin, do you feel things in Wisconsin are generally going in the right direction, or do you feel things have gotten off on the wrong track?” The data points resulted from the difference between the number choosing “right direction” and the number choosing “wrong track.” (The yellow dots mark the dates when that question was included on a poll.)
It is striking that as Wisconsin unemployment declined, an increasing fraction of the respondents chose “wrong track” over “right direction.”
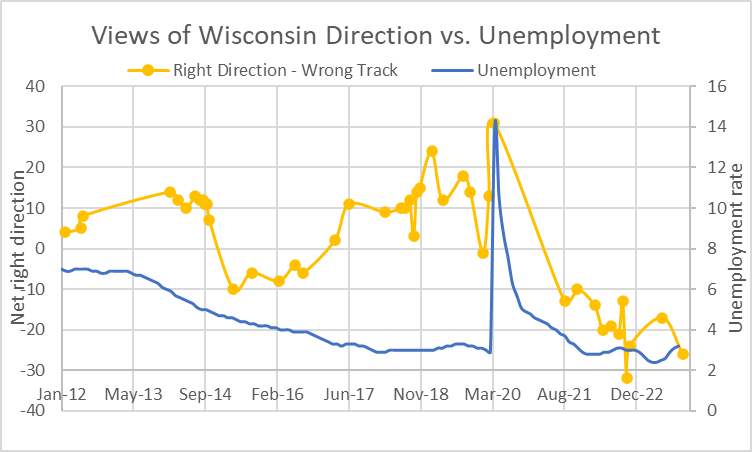
Views of Wisconsin Direction vs. Unemployment
The same theme emerges elsewhere. In the poll from early November, respondents were asked to rate the state of the nation’s economy as excellent, good, not so good, or poor. The next chart summarizes the results. To simplify, I combined the number saying excellent and good and the number saying not so good and poor. Taken as a whole, those viewing the economy negatively substantially outnumber those with a more positive view.
The graph also shows that opinions on the economy are very effected by partisanship. Republicans and their allies were overwhelming negative on the economy. A plurality of Democrats was positive, but not nearly as positive as Republicans were negative.

State of the Nation’s Economy
Responses to the most recent right direction/wrong track question showed a similar partisan bias. As the next graph shows, Republicans were strongly negative, while Democrats were moderately positive.
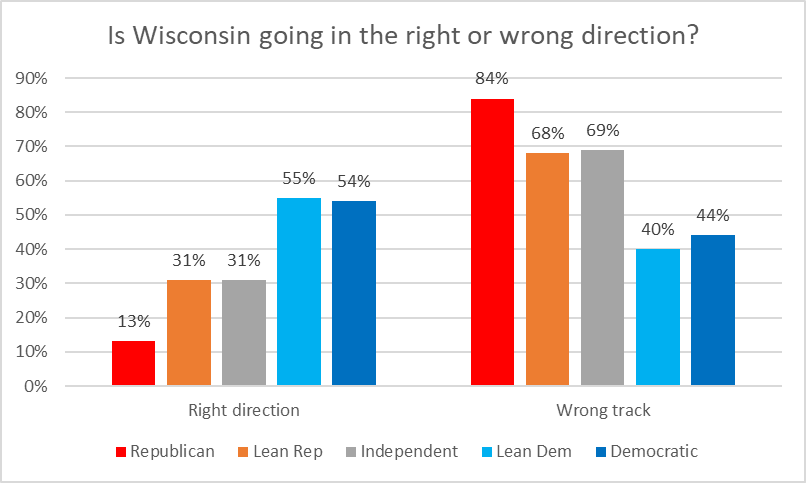
Is Wisconsin going in the right or wrong direction?
Another question repeated over time asked: “Thinking about your family’s financial situation, would you say you are living comfortably, just getting by, or struggling to make ends meet?” The next chart shows the results. In the four years since the pandemic hit, the number saying they live comfortably has declined while the number choosing just getting by and struggling to make ends meet has increased.

Are you living comfortably, just getting by, or struggling to make ends meet?
What accounts for this increasing pessimism? Besides partisanship, the recent bout of inflation is likely a major contributor. Even as unemployment shrank, higher prices meant less buying power.
Steven Rattner in the New York Times refers to a recent poll on the economy found that just 7 percent of respondents were principally concerned about the availability of jobs, while 64 percent were most worried about prices. That result should not be surprising. Even at the peak of job loss in 2020 with 14% of the labor force unemployed, that left 86% of the labor force employed. Higher prices, by comparison, hit nearly everyone.
Also, there is likely a good news/ bad news effect. Bad news about inflation dominated the good news on the increasing number of jobs.The next chart plots average real hourly wages for the period between January 2017 and November 2023. I adjusted the wages for inflation by converting them to 2020 dollars. These are based on three data series: all wages in the US (in yellow), all wages in Wisconsin (in green), and nonsupervisory wages in the US (in dark red).
All three series show a peak in early 2020. On first glance, this is counter intuitive. Why would employers pay more just when they were shutting back in response collapsing demand? The answer is that they were not paying more; they let go of a higher proportion of their lowest paid employees more than those paid more, raising average pay. This illustrates a limitation to the wage surveys: they don’t consider changes in the composition of the labor force.
For all three groups of employees, I added projected wages, shown as dotted lines. These were based on a regression model using wages between January 2007, as recovery from the Great Recession was getting underway, and January 2020, just before the pandemic hit.
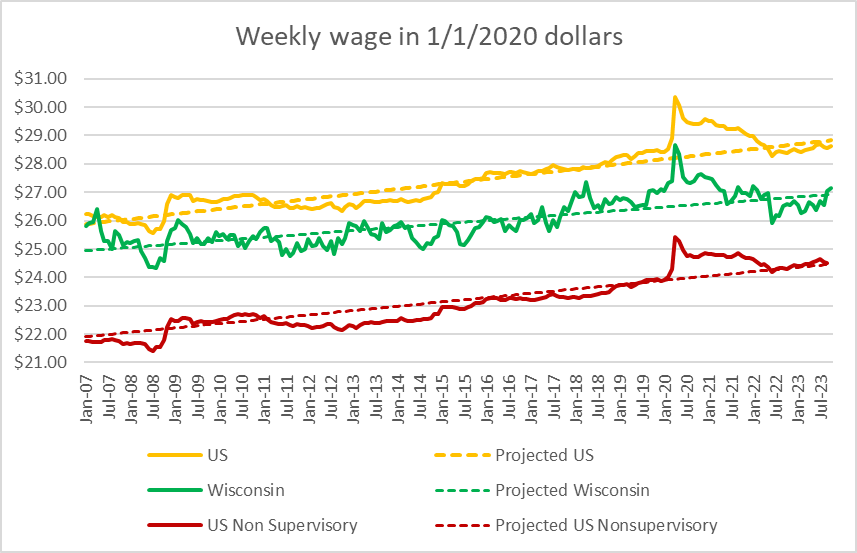
Weekly wage in 1/1/2020 dollars
In his op ed piece Ratner suggests a long-term cause for pessimism: a deep worry about the future:
An overwhelming share of Americans aren’t confident their children’s lives will be better than their own …
Restoring optimism about the future is a topic for a future column.
Data Wonk
-
Who Do You Trust to Conduct Elections Fairly?
 Apr 6th, 2026 by Bruce Thompson
-
Is Non-Citizen Voting a Real Threat to Elections in Wisconsin?
Mar 18th, 2026 by Bruce Thompson
-
How Global Climate Change Affects Milwaukee
 Mar 11th, 2026 by Bruce Thompson