
The Power of Wisconsin’s Gerrymander
Recent election results show how entrenched the Republican advantage is.
Vote here signs. File photo by Jeramey Jannene.
Newly elected Wisconsin Supreme Court Justice Janet Protasiewicz has been attacked by Republican politicians for describing the state’s Assembly and Senate districts as “rigged” to favor GOP candidates. Her toughest critic is Assembly leader Robin Vos, who contends that Protasiewicz should be impeached if she doesn’t recuse herself when the court considers two legal challenges to the districts. What does the evidence show?
Two recent elections help us see just how evenly gerrymandered the state is. Although elections for Supreme Court justices are nominally nonpartisan, increasing partisanship has resulted in a court whose justices are widely considered as being aligned with one or the other of the two parties. Thus there is a close alignment between voting patterns in the partisan 2022 election and the nominally nonpartisan 2023 April election. In the following graph, each dot represents one of the 99 Assembly districts. The horizontal axis shows the percentage of the vote received by Mandela Barnes, the Democrat, in his 2022 race for U.S. senator against Ron Johnson, the Republican.The vertical axis shows the percentage of the vote received by Protasiewicz in her race against Daniel Kelly for the Wisconsin Supreme Court. Protasiewicz was generally described as the liberal, Kelly as the conservative.
There are several things to note about this graph. One is that districts that supported the Democratic candidate for U.S. senator in 2022 mostly supported the liberal in 2023.
A second is that Protasiewicz’s victory statewide was widely spread across the state. In most of the districts, her margin exceeded those for Barnes. This is reflected in the graph by most dots above the diagonal, the green dashed line.
The graph also shows evidence of gerrymandering. The districts where far more than 50% of the vote is Democratic are evidence of “packing” in which Democrats are packed into some districts, reducing the number of majority Democratic districts. By contrast, Republican majority districts—represented by the dots on the left–are concentrated between 30% and 50% of the vote. This is evidence of “cracking” in which Republican voters are moved to formerly Democratic or competitive districts to make them Republican.

Democratic Assembly Districts 2023 vs. 2022
The graph below shows the estimated number of districts that Republicans and Democrats would win depending on their statewide results. The results for Republicans are shown in red; those for Democrats in blue.
The gap between the red and blue lines shows that the map is much more generous to Republican voters in awarding Assembly seats than to Democratic voters.

Wisconsin Assembly: Districts Won vs. Vote Percentage
How much more generous is reflected in the next graph, showing the number of districts won by each party, depending on their statewide vote. If Democrats received 44.5% of the statewide vote, they would win about 32 of the 99 Assembly districts. By contrast, Republicans would win 52 districts if they received 44.5% of the vote. Thus, while losing the state-wide vote, they would still control the Assembly.
The second cluster of columns shows the expected number of districts won in case of a tie. In that case Republicans could expect to win 61 of the 99 Assembly districts and Democrats win 38 for a gap of 23.
The final cluster of columns shows what happens to either party if it receives 55.5% of the vote. If Democrats do so, they would win about 47 seats, still short of a majority. By contrast, for Republicans to win 55.5% of the vote gives them about 67 districts, a gap of 20 districts compared to Republicans.
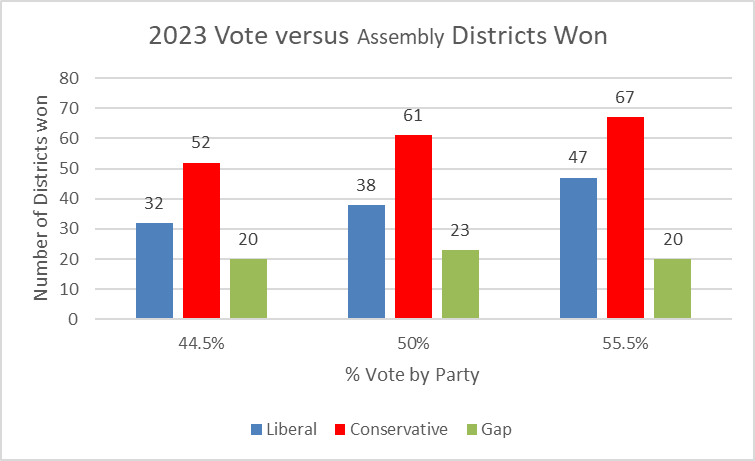
2023 Vote Versus Assembly Districts Won
To calculate these graphs, I started with the Wisconsin Elections Commission’s ward-by-ward report on this year’s election for Supreme Court. Then I added up the vote for each Assembly District.
Then I added votes to one candidate (in 1% increments), subtracting the same amount from the other candidate, and counting the number of Assembly districts that each candidate would receive as a result.
An underlying assumption in this exercise is that increases and decreases in the statewide vote would be reflected across the state. This assumption would break down if the change were to be concentrated in a few districts. The earlier graph comparing the vote by Assembly district in the 2022 U.S. Senate race to the 2023 Supreme Court vote suggests that this assumption is a good one.The next graph also suggests that the same assumptions hold for elections to the 33 state Senate districts. The liberal share of the district Supreme Court votes closely tracks the earlier U.S. Senate vote. Thirty one of the 33 Senate districts had higher Democratic percentages in 2023 than in 2022.
This graph also shows the distinctive signs of gerrymandering with widely spread liberal districts above 50% and highly concentrated conservative districts with liberal shares between 30% and 50%.
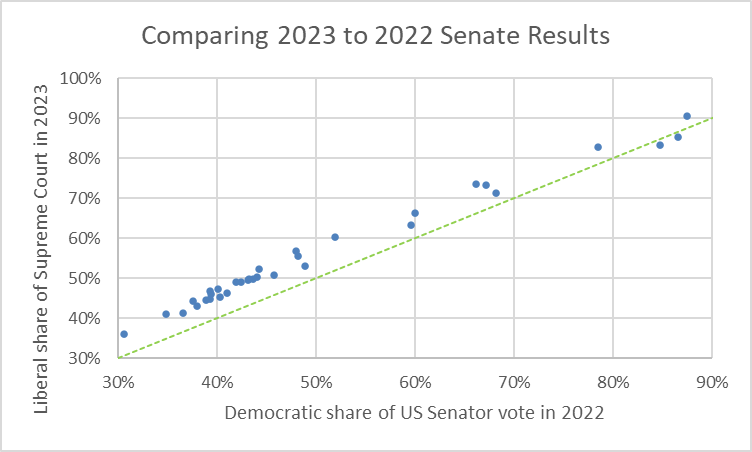
Comparing 2023 to 2022 Senate Results
As the next graph shows, the redistricting shows a similar bias towards electing conservatives.
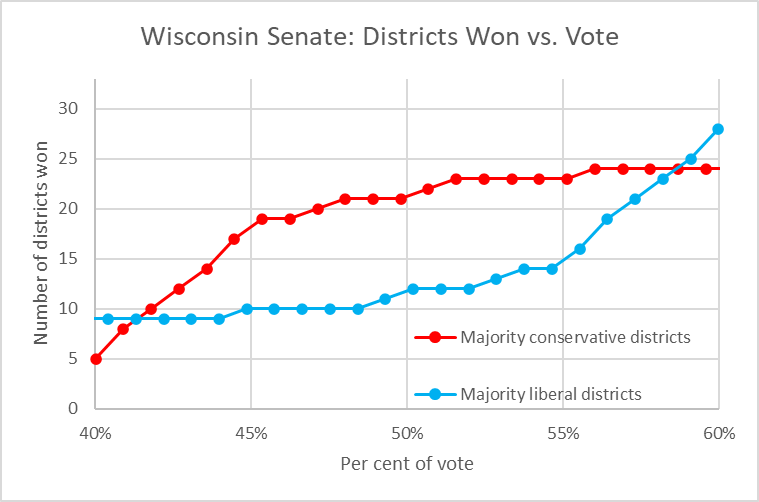
Wisconsin Senate: Districts Won vs. Vote
The next graph shows the number of projected state Senate seats won by each party.
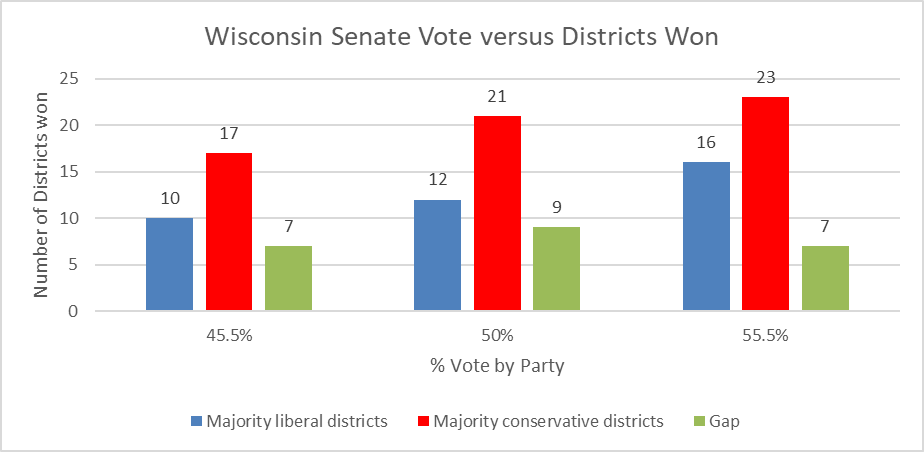
Wisconsin Senate Vote versus Districts Won
Thus, turning votes into either Wisconsin Senate or Assembly seats is far more challenging for Democratic voters than for Republicans. This makes it far more difficult for Democratic voters—roughly half the state’s population—to see their desires translated into legislation than for Republican voters.
There are two main arguments made by defenders of the Wisconsin gerrymander. One is that candidate quality is the source of the lack of success by Democrats. The other is that Democrats are very concentrated mostly in Milwaukee and Madison resulting in “packed” districts through no fault of the map makers.
The first argument runs up against the fact that the curves above are based on an assessment of the vote for Supreme Court, in which the same two candidates ran in every district. Candidate quality cannot explain the discrepancy between the parties’ results.There is an element of truth to the second argument, but geography falls far short of explaining most of the Republican advantage. As I’ve previously written, it is quite possible to create a legislative map for Wisconsin that is better at meeting all the requirements considered by courts, including the number of minority seats, compactness, splitting (whether they split cities, counties, and wards), and still achieve proportionality (whether the partisan distribution of seats was proportional to the vote). A website called Dave’s Redistricting shows that rates a map aimed at maximizing proportionality also did a better job on the other measures than the map adopted by the state Legislature.
The root problem is that the Republican Party has been taken over by people who rate their continued power more highly than democracy itself. The recent introduction and passage in the house of Assembly Bill 415 suggests a recognition that the current map is indefensible. It was introduced on Sept. 12 and passed by the Assembly with the support of all Republicans and one Democrat.
Supposedly modeled on Iowa’s redistricting system, AB415 would charge the nonpartisan Legislative Reference Bureau (LRB) with coming up with new maps for Senate and Assembly districts, which would then go to the Legislature, which could vote them up or down. No substantive amendments would be allowed. If rejected by the Legislature, the maps would be revised by the LRB and sent back to the Legislature. This process could be repeated a third time.
In contrast to present practice, AB415 mandates that:
In preparing the plan, the LRB must be strictly nonpartisan. No district may
be drawn for the purpose of favoring a political party, incumbent legislator, or other person or group.
While AB415 is certainly a step in the right direction, there are concerns. One is the speed with which it was considered—only two days between introduction and passage. That would seem to give no time to consider various scenarios and what could go wrong.
One such scenario is that the Legislature repeatedly rejects the LRB’s maps. Wisconsin’s Republicans have a history of creating regulatory systems, but then objecting and resisting when the product is not to their liking.A glaring example is offered by the Government Accountability Board, which was created with bipartisan support to manage elections and government ethics. It was then dissolved because of unhappiness with an investigation into whether Republican Governor Scott Walker‘s campaign had unlawfully coordinated with the Club for Growth and other “outside” groups during the 2012 recall election.
A second example is the current effort to fire the Executive Director of the Wisconsin Elections Commission because of unhappiness among the MAGA crowd that Trump lost the vote in Wisconsin.
With AB415 it is unclear as to what happens if the Legislature repeatedly rejects the LRB’s maps. If the answer is that the Legislature decides, the result might be a new partisan gerrymander.
More about the Gerrymandering of Legislative Districts
- Without Gerrymander, Democrats Flip 14 Legislative Seats - Jack Kelly, Hallie Claflin and Matthew DeFour - Nov 8th, 2024
- Op Ed: Democrats Optimistic About New Voting Maps - Ruth Conniff - Feb 27th, 2024
- The State of Politics: Parties Seek New Candidates in New Districts - Steven Walters - Feb 26th, 2024
- Rep. Myers Issues Statement Regarding Fair Legislative Maps - State Rep. LaKeshia Myers - Feb 19th, 2024
- Statement on Legislative Maps Being Signed into Law - Wisconsin Assembly Speaker Robin Vos - Feb 19th, 2024
- Pocan Reacts to Newly Signed Wisconsin Legislative Maps - U.S. Rep. Mark Pocan - Feb 19th, 2024
- Evers Signs Legislative Maps Into Law, Ending Court Fight - Rich Kremer - Feb 19th, 2024
- Senator Hesselbein Statement: After More than a Decade of Political Gerrymanders, Fair Maps are Signed into Law in Wisconsin - State Senate Democratic Leader Dianne Hesselbein - Feb 19th, 2024
- Wisconsin Democrats on Enactment of New Legislative Maps - Democratic Party of Wisconsin - Feb 19th, 2024
- Governor Evers Signs New Legislative Maps to Replace Unconstitutional GOP Maps - A Better Wisconsin Together - Feb 19th, 2024
Read more about Gerrymandering of Legislative Districts here
Data Wonk
-
Who Do You Trust to Conduct Elections Fairly?
 Apr 6th, 2026 by Bruce Thompson
-
Is Non-Citizen Voting a Real Threat to Elections in Wisconsin?
Mar 18th, 2026 by Bruce Thompson
-
How Global Climate Change Affects Milwaukee
 Mar 11th, 2026 by Bruce Thompson


Great article Bruce. Hopefully this data will be helpful in the lawsuit.