
Do Democratic Voters Live Longer?
Data shows a powerful connection between life expectancy and partisanship.

Early voting sign outside the Zeidler Municipal Building. Photo by Jeramey Jannene.
Recent research published in the British Medical Journal compared death rates for American counties from 2001-2019 with the partisan vote by the counties in the five presidential elections between 2000 and 2016.
Data on county death rates, called “age adjusted mortality rates” or AAMRs, per 100,000 residents came from the Centers for Disease Control and Prevention (CDC) “WONDER” database. Counties were classified as either Democratic or Republican based on the MIT US presidential elections data.As the chart below shows, the research shows a growing gap between counties that voted for the Republican candidate for president and those that voted for the Democratic candidate. In fact, the decline in the average mortality rate over this 18-year period in Democratic counties (22%) was twice that of the Republican counties (11%).
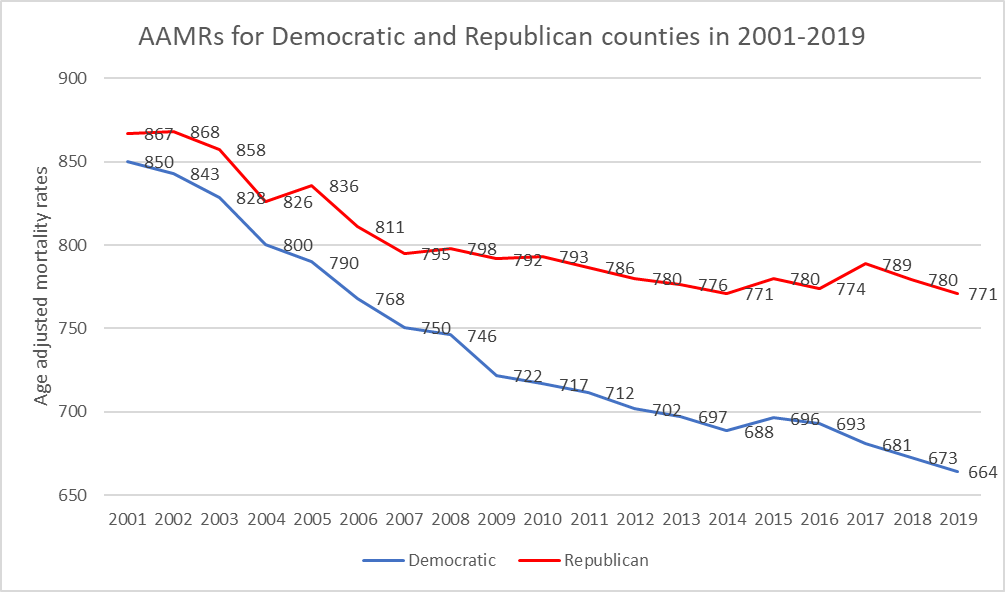
AAMRs for Democratic and Republican counties in 2001-2019
The study also reported on various subgroups: male versus female, white, Hispanic, and Black, and whether a person lived in a large metropolitan area, a medium-size one, or a rural area. In every case on average, living in a Democratic county rather than in a Republican one lowered the likelihood of a mortality event.
Not surprisingly, women did better than men and living in a large city was an advantage over living in a medium-sized city, which in turn was an advantage over living in a rural county. More surprisingly, Hispanics had lower mortality than whites. Whites, in turn, had lower mortality than Blacks.
The study report that the “greatest contributors to the widening AAMR gap between Republican and Democratic counties were heart disease (difference in AAMRs 27.6), cancer (17.3), and chronic lower respiratory tract diseases (8.3), followed by unintentional injuries (3.3) and suicide (3.0).”It should be noted that the data used runs through the year 2019. Thus, the gap does not reflect the COVID-19 pandemic. That said, it is likely that some of the attitudes that underlie the different responses to Covid between Democrats and Republicans may have affected the sickness and mortality rate.
Mortality rates are the obverse of life expectancy. The lower the rates the longer people would be expected to live, and vice versa.
The next chart summarizes World Bank estimates of life expectancies among nations. The bank puts them into three groups: high income including the United States, middle income, and low income. In the years since 1960, the most dramatic gains in life expectancy have been among low (shown in red) and middle-income nations (in gray).
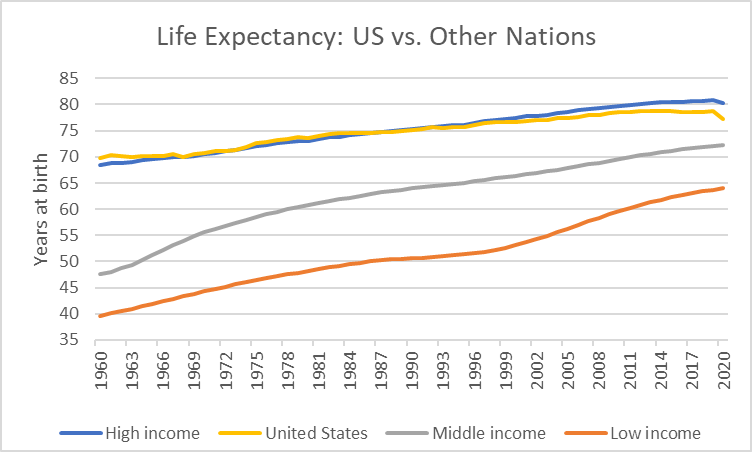
Life Expectancy: US vs. Other Nations
In recent years, the United States has lost its lead among the high-income countries when it comes to increasing life expectations. As can be seen in the graph below, after starting in 1960 more than a year ahead of the average high-income nation, by 2020 the United States underperformed the average by three years.
While the underperformance of U.S. life expectation growth was a long-standing trend, the most recent downturn is attributable to the Covid pandemic. In 2020, Americans’ average life expectations declined by a year and a half, following five years that were essentially flat.
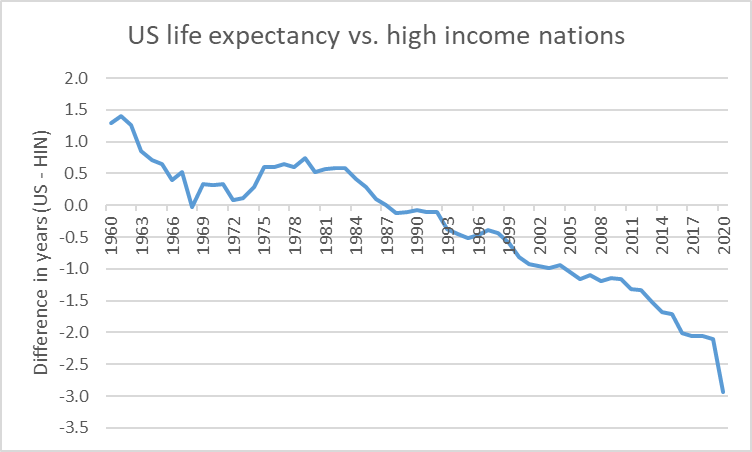
US Life expectancy: vs. high income nations
There seem to be two closely related phenomena here, demanding explanation. The first is the lower life expectancy of people living in counties that voted for Republican presidential candidates. The second is the relative slippage in U.S. life expectancy compared to other high-income nations.
Politically, Wisconsin is among our five or six most competitive states, evenly divided between Democrats and Republicans. It also falls in the middle of many other lists, or a bit ahead of the average. That is also true in the case of life expectancy. According to a list developed by the University of Wisconsin Population Health Institute, in 2019 the average life expectancy in Wisconsin was 79.5 years, placing it at 20th among the 50 states.Responses to survey questions from the Marquette Law School poll of Wisconsin voters may offer a window of light on possible causes.
The next graph shows the relationship between support for the Affordable Care Act (ACA) and voters’ favorability (or unfavorability) towards then-president Donald Trump. Most other wealthy nations—and a good many less wealthy—have universal, or near universal health care. The Affordable Care Act was a step towards covering a greater proportion of the population.
The next graph, combining three surveys between 2018 and 2020, shows the relationship between Trump approval and support for the ACA. Fewer than 12% of Trump supporters thought that the ACA was a good idea. The likely result of this hostility to the Obamacare expansion of coverage played out in convincing some people, particularly in Republican-dominated counties, to go without coverage. This would result in lower usage of medical facilities in Republican counties contributing to greater mortality rates in Trump country.
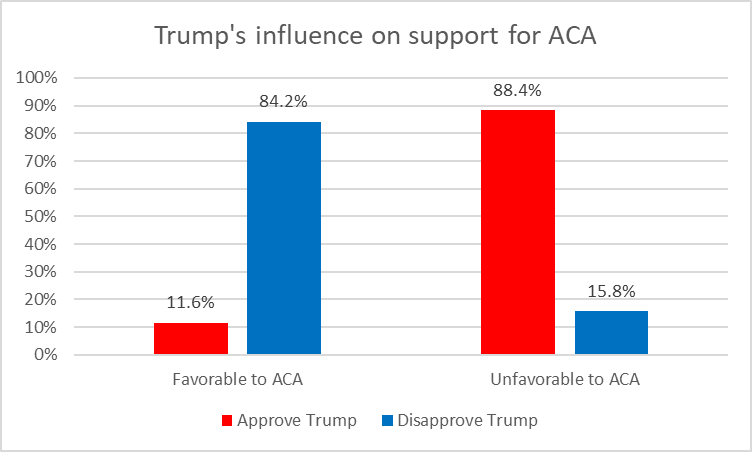
Trump’s influence on support for ACA
There are a number of other possible contributors to higher mortality in Republican counties. These include:
- The greater availability and acceptance of guns in Republican counties, resulting in deaths from suicide and homicides
- Suspicion of science, resulting in a resistance to measures aimed at controlling the spread of disease and decisions to adopt unproven treatments, as evidenced by the numerous unproven responses to the Covid pandemic.
Political factors often play a major, but largely ignored, role in determining the health and life expectancy of a population. It seems clear that the political environment can be strongly connected to the residents’ health and even how long they live. This factor is associated with policies, laws, and regulations that influence health, including safety net programs, tobacco control, gun laws and environmental protections.
It is less clear to me as to what is the dominant direction of causation. Do residents of Democratic counties benefit from some characteristic of these counties that help them live longer lives? Or are these counties able to attract people able to live longer and healthier lives? I would hope that future research would help answer these questions.
In particular, it is important to understand why the gap between Democratic and Republican counties has grown so dramatically in the past 20 years. Lives may depend on this.
Data Wonk
-
Who Do You Trust to Conduct Elections Fairly?
 Apr 6th, 2026 by Bruce Thompson
-
Is Non-Citizen Voting a Real Threat to Elections in Wisconsin?
Mar 18th, 2026 by Bruce Thompson
-
How Global Climate Change Affects Milwaukee
 Mar 11th, 2026 by Bruce Thompson


Freedom vs. Freedumb
It appears that persons living in rural areas, to use an Ayn Rand term, are the “takers”. These areas are heavily dependent on Medicare, Medicare, large Federal farm handouts, and, if State wide school choice is ever passed, will have their children’s religious education paid for by the State in choice schools with tax money from the “makers”. Meanwhile, the Republicans will continue their war on urban areas underfunding education and basic government services while creating a new rural welfare class.