
Why Are Our Congressional Districts So Gerrymandered?
Key reason: too much emphasis on 'communities of interest.'
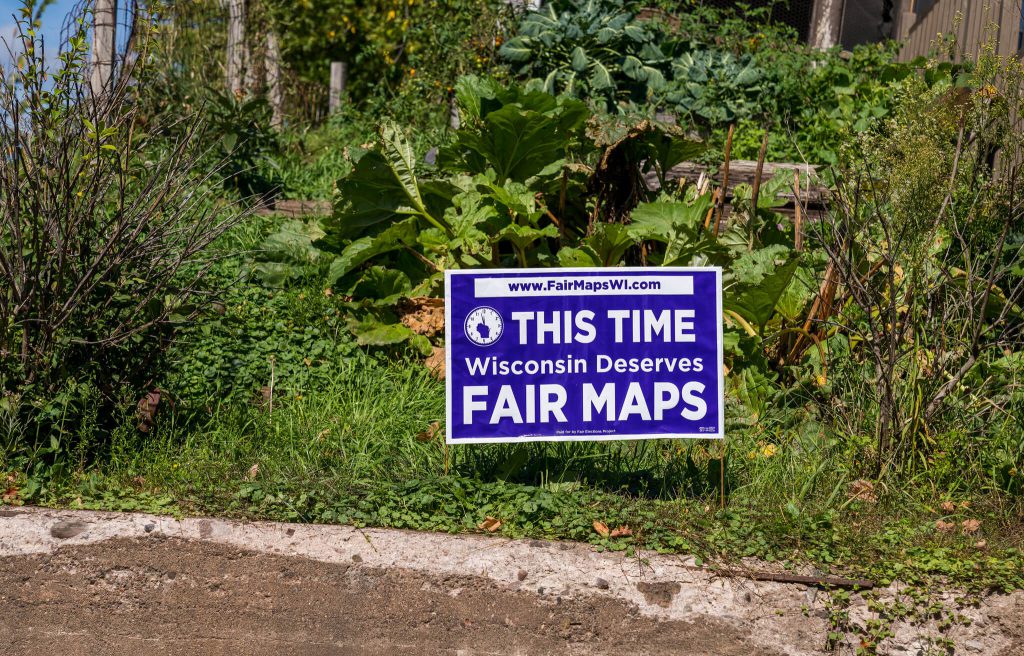
A yard sign in Mellen, Wisconsin reads: “This Time Wisconsin Deserves Fair Maps,” paid for by the Fair Elections Project, FairMapsWI.com. The political sign supports redistricting legislation to reform gerrymandering. Wisconsin Fair Maps Coalition by Tony Webster (CC BY 2.0) https://creativecommons.org/licenses/by/2.0/
The recent redistricting of the Wisconsin Legislature has given our state a dubious distinction: it is widely considered one of the most gerrymandered states in the nation. So while Wisconsin is considered among the most competitive states in America, based on the outcome of statewide races, in the state Legislature, Republicans have given themselves a seemingly unbreakable lock on power. See, for example, two articles recently published in Urban Milwaukee here and here.
The next graph shows the outcome of the five races for statewide offices that appeared on last November’s ballots. The vote for the Democratic candidate is shown in blue; that for the Republican in red. The first three races—for governor, attorney general, and secretary of state–were won by Democrats. The last two—for state treasurer and U.S. Senator—were won by Republicans.
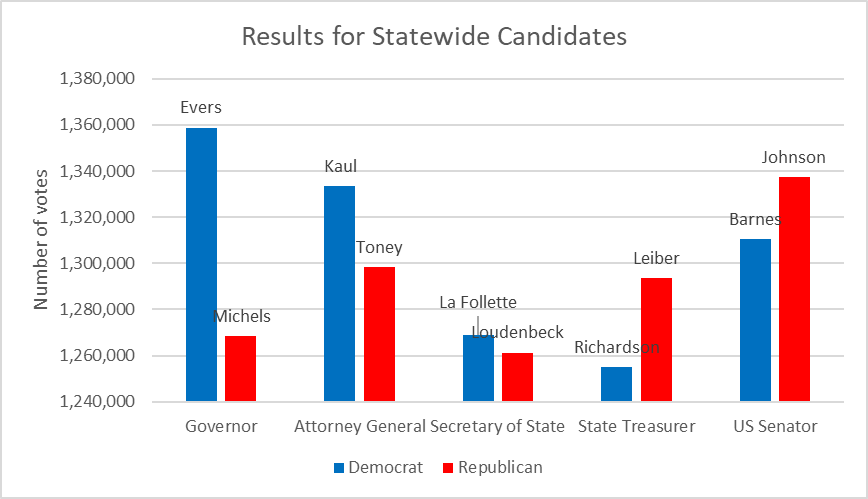
Results for Statewide Candidates
By starting at 1,240,000, the previous chart minimizes the closeness of the statewide vote. The next chart starts the bars at zero.
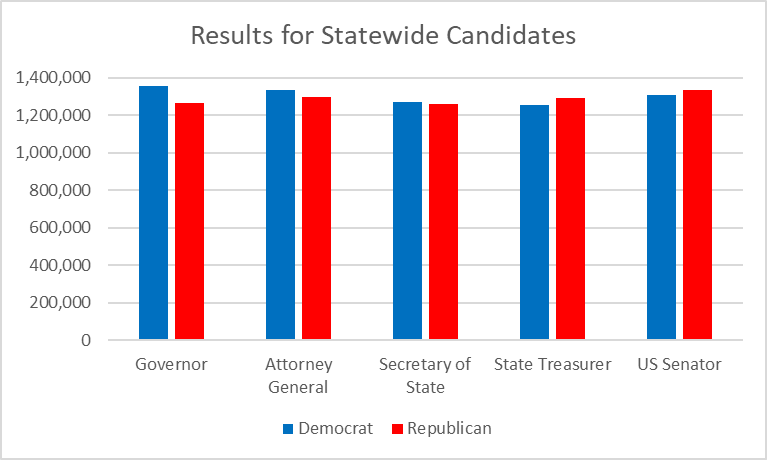
Results for Statewide Candidates
The difference between winning and losing almost disappears when the chart starts at zero. Out of two and a half million votes, the difference between winning and losing is a matter of numbers between seven and ninety thousand, as shown below. The bars show the winning vote margins in terms of votes (using the scale on the left). The line shows the margin as a percentage of the total vote, using the scale on the right.
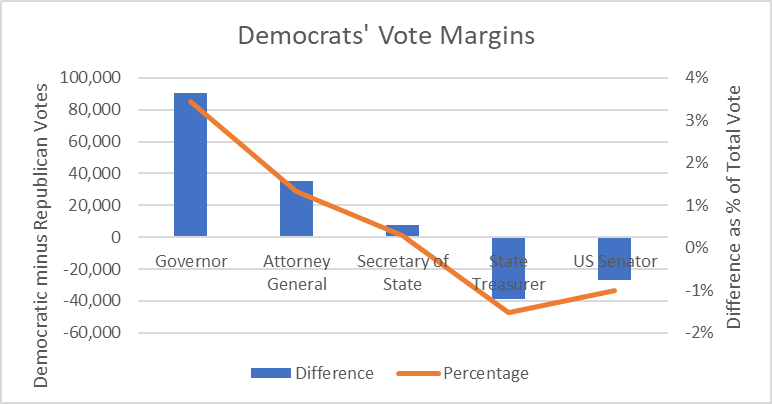
Democrats’ Vote Margins
The votes for candidates to represent Wisconsin in the United States House of Representatives tells a very different story. Rather than a story of competition, four of the eight are owned by the Republican party. In fact, in two districts, the sixth and eighth, no Democrat was willing to undertake a campaign programmed to fail.
In two other districts—the second, incorporating Madison and Dane county–and the fourth, including most of Milwaukee, are a lock for Democrats.The other two, the first and third, are nominally competitive and in a good year for Democrats might be convinced to vote Democratic. Both districts went for Trump in 2020.
The missing Democratic voters in districts 6 and 8 point to a limitation when trying to understand the partisan orientation of those districts. If there is no Democratic candidate there are no Democratic voters. It is also possible that Republican voting may have been undermeasured in these districts. Some Republican voters may decide to skip voting for candidates who are sure to win.
In addition, some apologists for the gerrymander may use this to claim that the Democrats’ problem is not the gerrymander. Rather, they will claim that Democrats’ lack of success reflects an inability to recruit strong candidates.
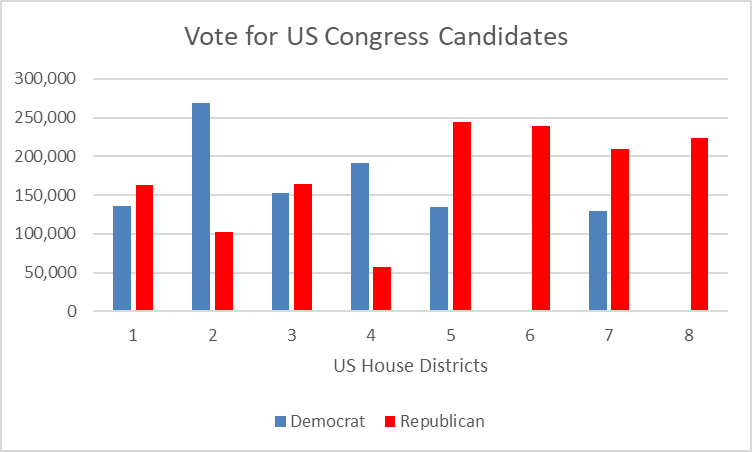
Vote for US Congress Candidates
The graph below shows how the Democratic and Republican candidates for Attorney General fared in each of the U.S. House districts. This approach gets around the problems of missing candidates and of candidate quality. For a statewide candidate every vote is just as valuable as every other, whether it comes from the heavily Democratic 2nd District or the heavily Republican 6th.
Despite winning a (slight) majority of votes across Wisconsin, Attorney General Josh Kaul lost six of the eight U.S. House districts, coming closest in the 3rd. How is that possible? Because the redistricting packed so many Democratic voters in the Milwaukee and Dane County congressional districts, helping Republicans dominate in the other districts.
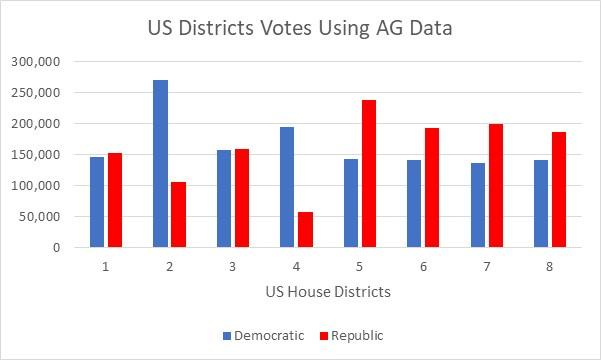
US Districts Votes Using AG Data
Could a redistricting plan have been developed that better reflected the political preferences of Wisconsin voters? The People’s Map Commission developed a number of maps. One, called “Peoples Proposal D”, would have created three districts with a heavy Republican lean and three strongly Democratic. The remaining two would have been competitive, defined as falling in the 45–55% range, with one favoring the Democrats and the other favoring Republicans.
How did they do this? From viewing the map of this plan, it appears the most important decision in designing the map was to split Madison and Dane County, creating two majority Democratic districts and converting a previously Republican district into a competitive one. Other districts became somewhat less partisan than before.
Despite the Commission’s success in creating a fairer map that better reflected Wisconsin’s voting population, Proposal D did not make the final cut. The commission proposed a map with 4 Republican, 2 Democratic, and 2 competitive districts, somewhat better but similar to that adopted by the Republican Legislature.Why did the Commission take this route? I suggest several factors. For one thing the commission listed four groups of criteria for the maps it would draw. The fourth, and last, group was “Partisan Fairness – Among the mapping plans that satisfy all higher priorities, a preference will be given for plans that tend to lead to proportional outcomes, defined as the share of representation for each party roughly equal to statewide share of support.” So partisan fairness came at the bottom, only after the other criteria were met.
Among those higher order criteria was preserving “Communities of Interest.” They defined these as “geographic areas or neighborhoods contained within a contiguous area on a map where residents share common interests and bonds that deserve consideration by elected representatives.” How better to preserve communities of interest than by keeping the residents of Milwaukee or Madison together. But “packing” voters of one party together is Gerrymandering 101, it’s a key way to create uncompetitive districts.
Today, when so much political strategy is based on vilifying the opposition, forcing political leaders to deal with constituents with different priorities and beliefs seems a good idea to me. At a time when social media makes it easy to find like-minded people a bit of disruption of communities of interest may be a good thing. And it’s a vital step to ending gerrymandering.
Data Wonk
-
Who Do You Trust to Conduct Elections Fairly?
 Apr 6th, 2026 by Bruce Thompson
-
Is Non-Citizen Voting a Real Threat to Elections in Wisconsin?
Mar 18th, 2026 by Bruce Thompson
-
How Global Climate Change Affects Milwaukee
 Mar 11th, 2026 by Bruce Thompson


Out of eight races for the House of Representatives in 2022, only one, maybe two, was competitive. Two races had only one candidate. This is bad for Wisconsin. Without competition, too many Wisconsin members of the House think they are in a retirement home where they can spend all day collecting money for their next election. They are not working on solving the problems the people of Wisconsin face. That goes for House members of both parties. Very few of them are relevant on the national stage. None of this works for the people.
*reads the title*…. Because republicans drew the lines?
And even if a fair map could exist, the republican-leaning court will strike it down and install a republican one anyway?