
Analyzing Milwaukee Area Turnout and Results That Led To Evers’ Win
Governor pulled off something no Wisconsin Democrat has accomplished in 60 years.
Ballots at the City of Milwaukee central count facility. Photo by Jeramey Jannene.
Governor Tony Evers was re-elected Tuesday by approximately 89,000 votes, tripling his 2018 margin of victory. This makes him the first Democratic gubernatorial candidate in Wisconsin since 1962 to win a midterm election while a Democrat occupied the White House. He won, in large part, by picking up a bigger share of the vote in Milwaukee’s suburbs.
The Milwaukee metro shifted toward Evers even more than the rest of the state. Collectively, Milwaukee, Waukesha, Ozaukee, and Washington counties gave Evers a victory of just under 18,000 in 2018. That nearly quadrupled to more than 70,000 in 2022. This Democratic momentum came entirely from the suburbs. Evers did win a slightly higher proportion of Milwaukee’s vote in 2022, but overall city turnout declined by about 36,000.The Milwaukee County suburbs more than made up the difference. Due to dwindling turnout, Evers netted 13,700 fewer votes from the city of Milwaukee, but his haul from the suburbs grew by over 24,000. The Waukesha-Ozaukee-Washington (WOW) counties are still solidly Republican, but GOP margins of victory shrank rapidly. Waukesha County gave Walker a 34-point victory in 2018; Evers’ opponent Tim Michels won Tuesday by 20 points. Ozaukee gave Walker a 27-point victory; Michels won by 11. Even Washington County, the most conservative voting of the three, shifted toward Evers by 8 points.
| 2018 and 2022 gubernatorial election results in the Milwaukee metro | ||||||
| Tony Evers’ margin of victory | ||||||
|---|---|---|---|---|---|---|
| 2018 | 2022 | shift | ||||
| votes | points* | votes | points* | votes | points* | |
| Milwaukee County | ||||||
| C. Milwaukee | 125,086 | 58.4 | 111,386 | 62.9 | −13,700 | 4.5 |
| suburbs | 12,983 | 7.2 | 37,474 | 22.0 | 24,491 | 14.8 |
| Waukesha County | −74,568 | −33.6 | −45,645 | −20.3 | 28,923 | 13.3 |
| Ozaukee County | −13,675 | −26.7 | −5,723 | −10.9 | 7,952 | 15.8 |
| Washington County | −32,255 | −45.7 | −28,057 | −37.9 | 4,198 | 7.8 |
| 2022 data is unofficial. Calculations by John D. Johnson (@jdjmke) | ||||||
| * Democratic percent of the vote minus Republican percent of the vote | ||||||
Swinging Suburbia
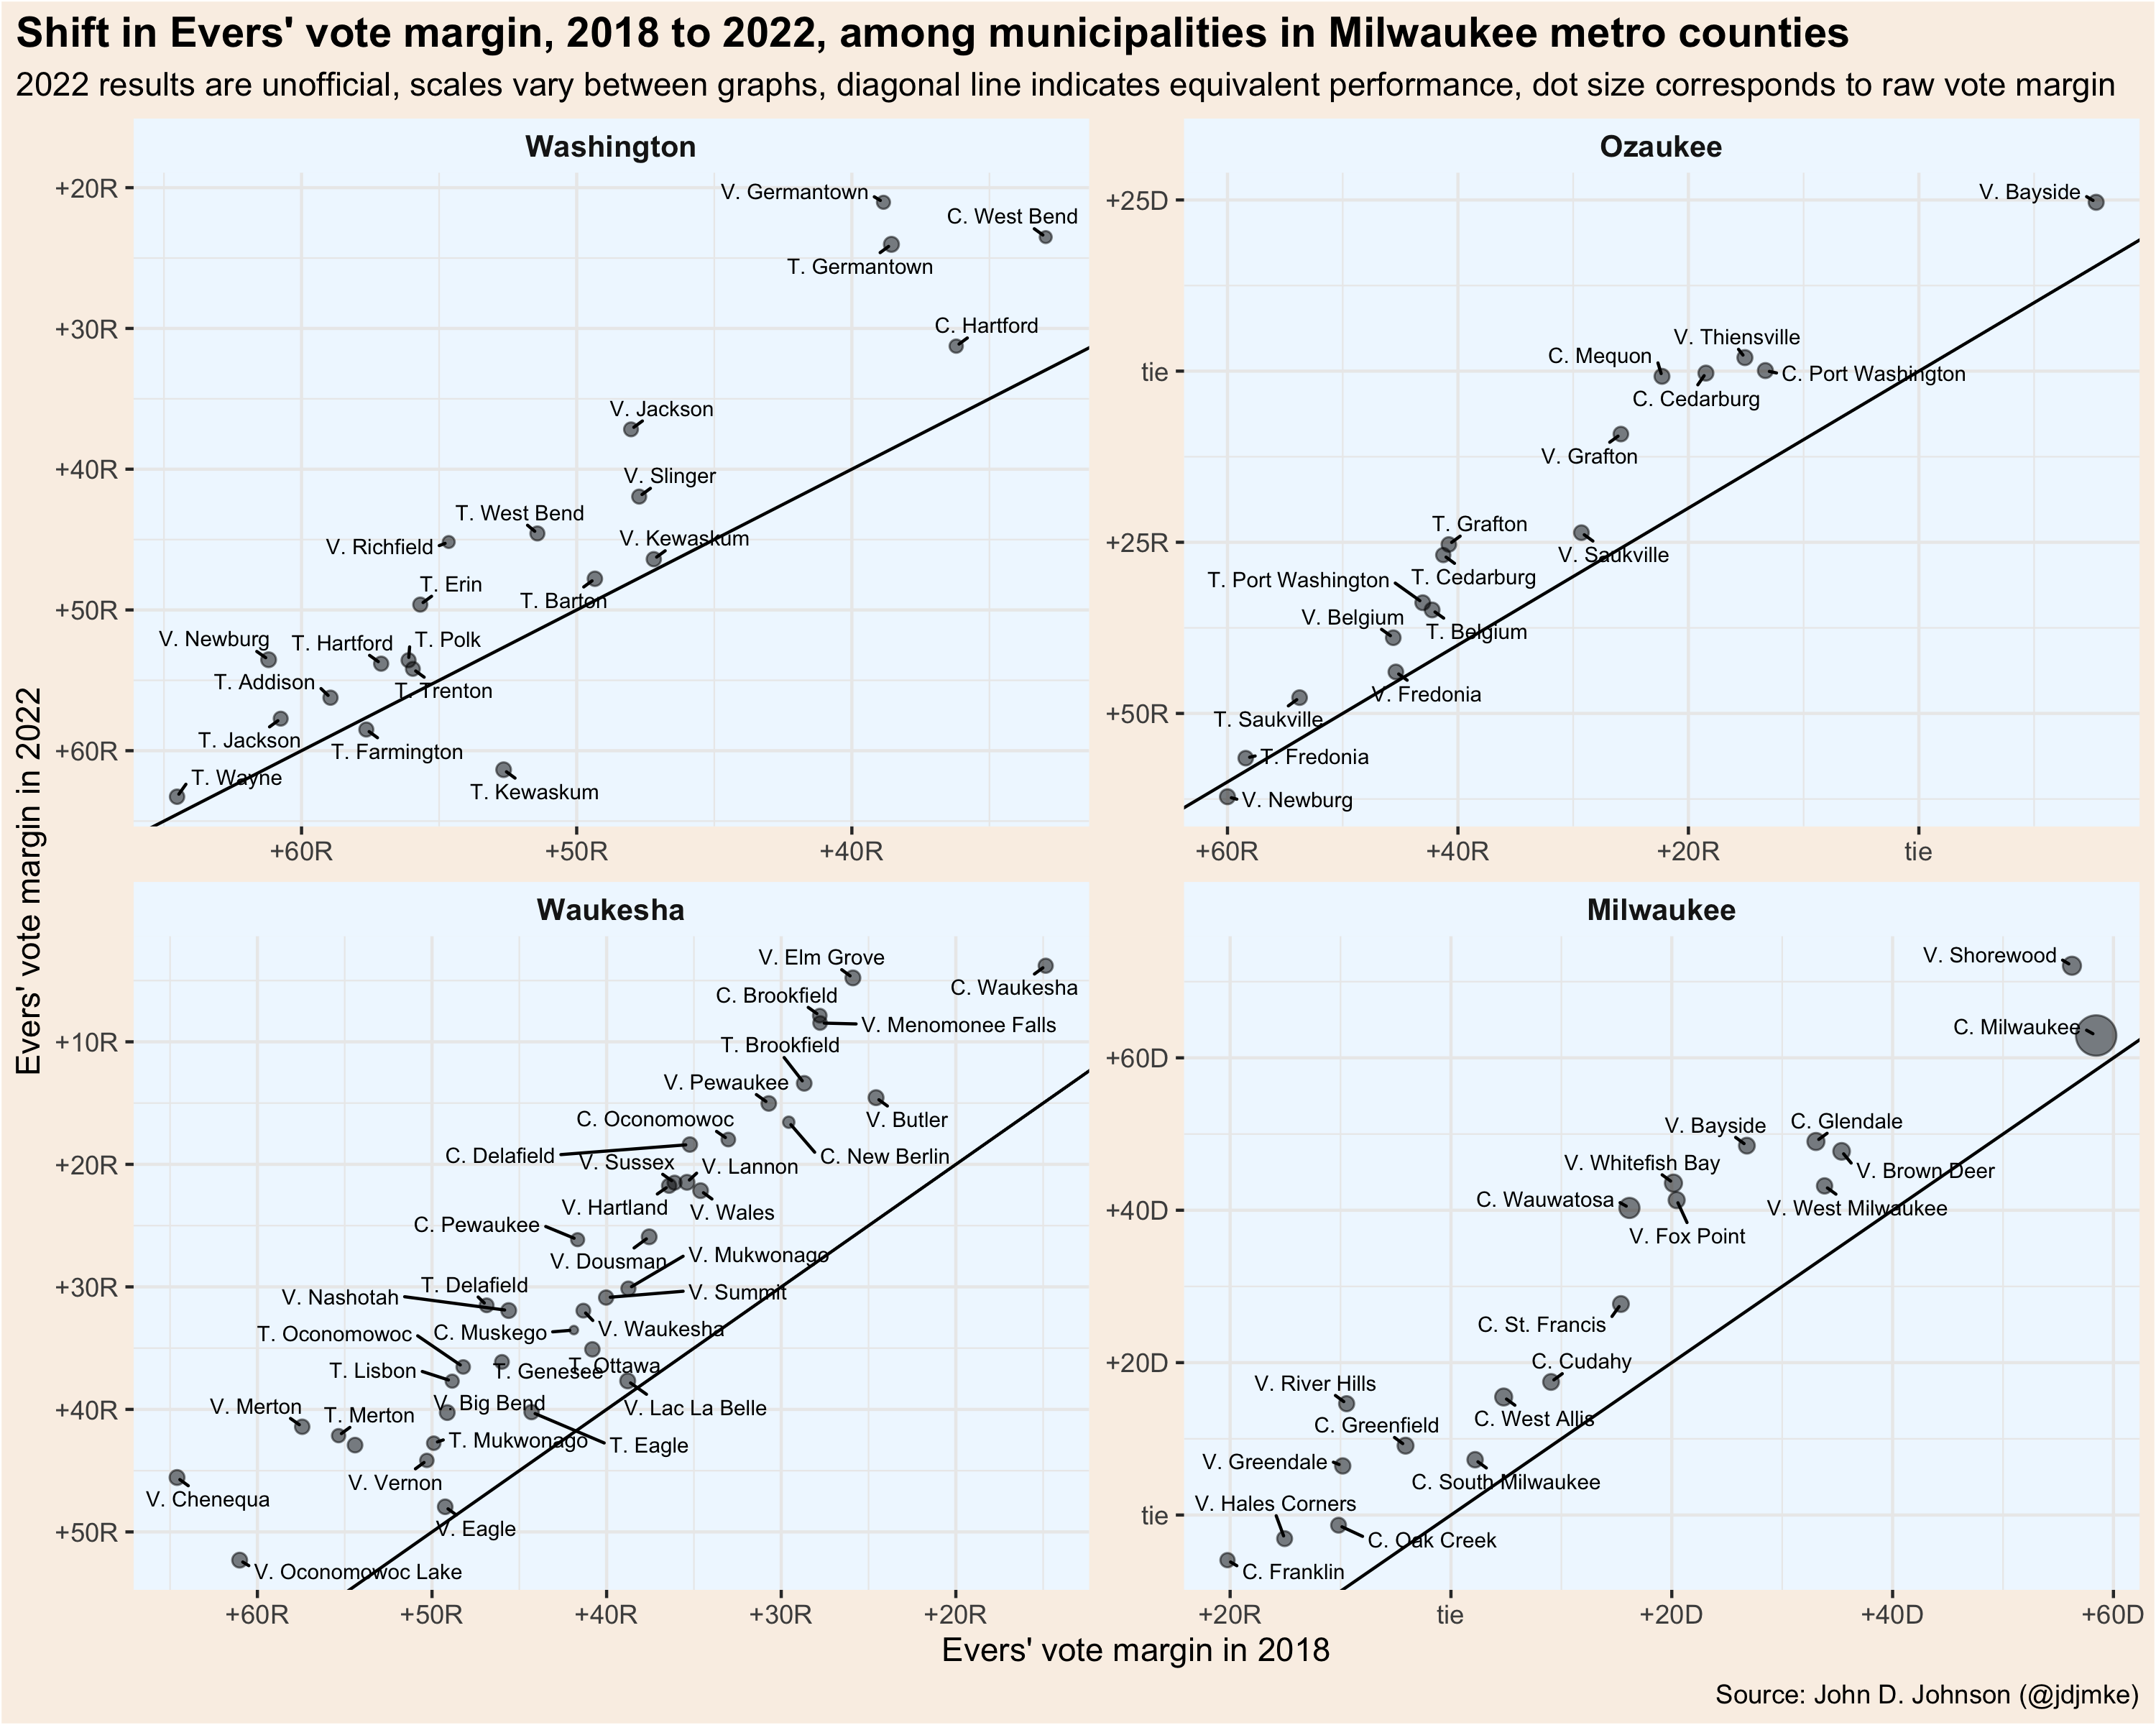
The graphs below show how each county’s municipalities shifted between 2018 and 2022. Every community in Milwaukee and Waukesha counties gave Evers a higher proportion of the vote in his re-election campaign. Only one municipality in Ozaukee County and two in Washington County swung the other way. Evers flipped Greendale, Greenfield, and River Hills in Milwaukee along with Port Washington and Thiensville in Ozaukee.
The largest shifts came in Wauwatosa (+24), River Hills (+24), Whitefish Bay (+23), Bayside (+22), Mequon (+22), Elm Grove (+21), Fox Point (+21) and Brookfield (+20).
Municipal results, Governor’s race. Image by John D. Johnson.
This map shows results from the governor’s race in reporting units, the most granular level available. For clarity, the map on the left uses a continuous color scale to show the degree of support for either candidate, while the map on the right simply shows the winner. A decade ago, both parties were competitive in the inner ring Milwaukee County suburbs. Now, those suburbs are more reliably blue and the battlegrounds have shifted to the eastern fringe of Waukesha County and the southern half of Ozaukee County.
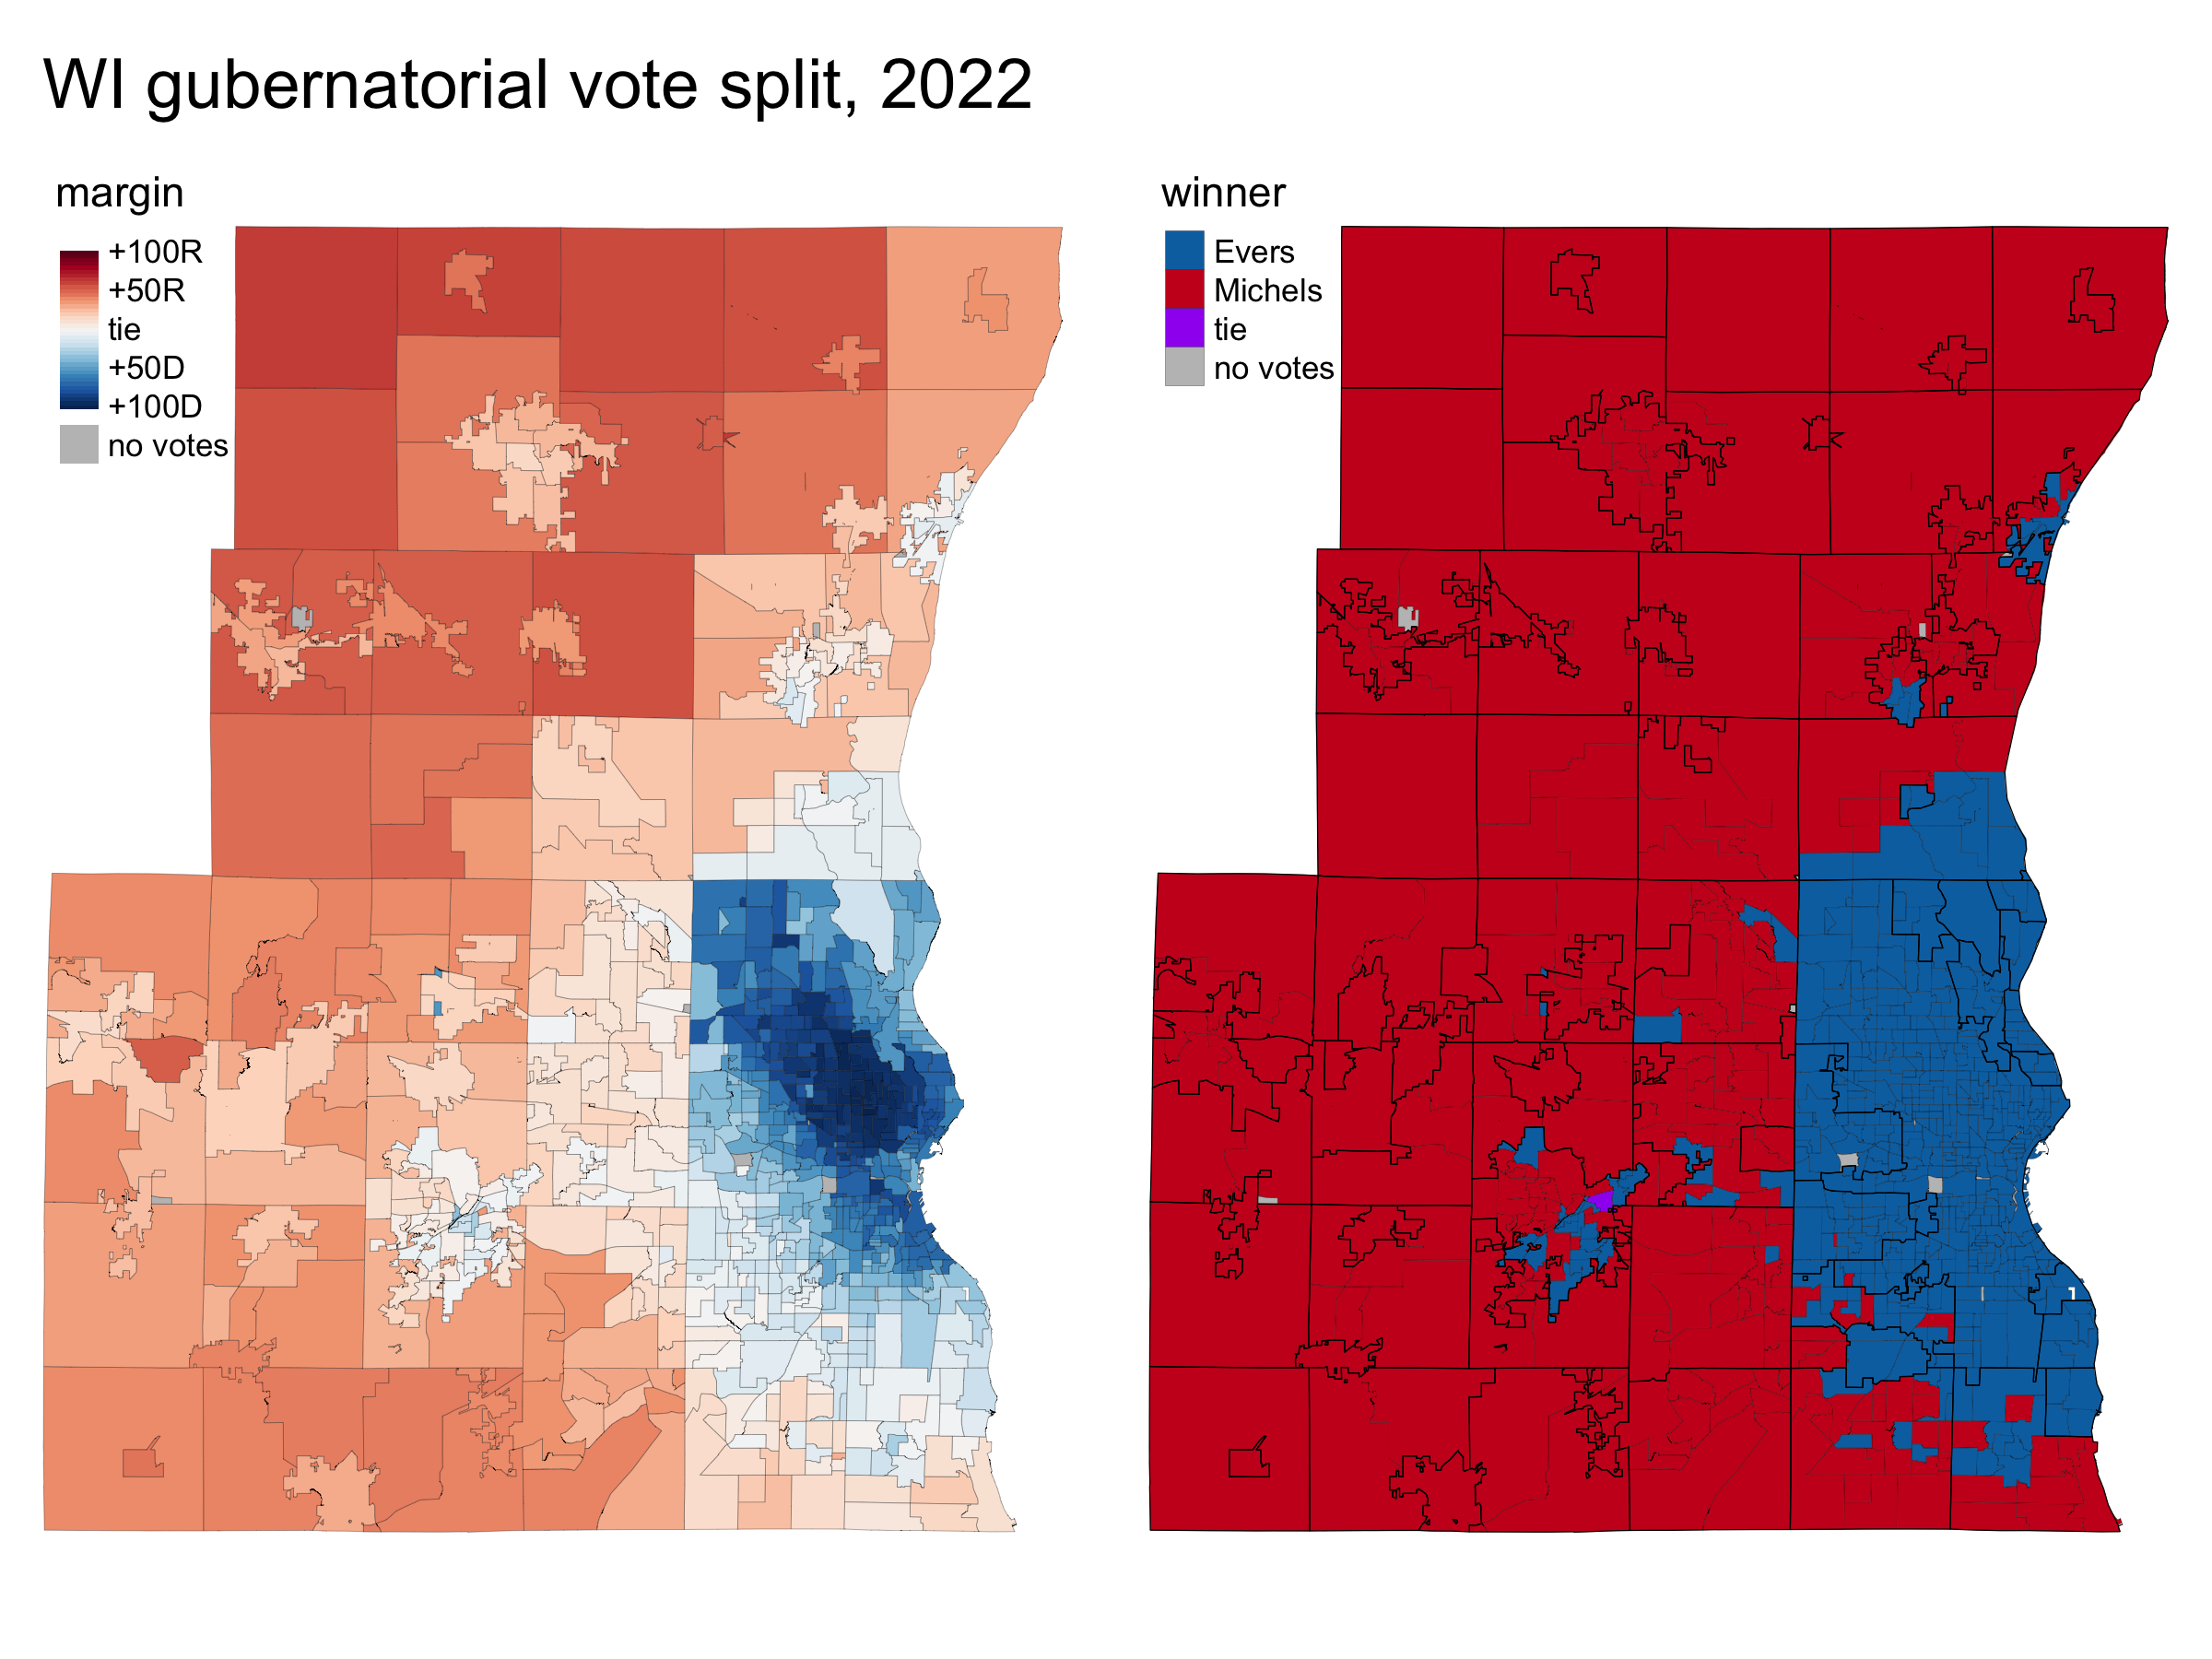
unofficial gubernatorial results shown in reporting units. Map by John D. Johnson (@jdjmke).
Falling Turnout?
Much attention has already been paid to Milwaukee’s decline in voter turnout. Voters in the city cast over 216,000 votes in 2018, representing about 74% of those registered before election day. In 2022, just under 180,000 Milwaukeeans voted, or 63% of registered voters.
But turnout declines are not limited to Milwaukee. As I write this, the AP reports 2.65 million votes cast in the governor’s race. If that total holds, it is a drop of about 25,000 compared to 2018. The number of registered voters on Nov. 1 was just over 3.51 million, compared to 3.25 million in 2018. Consequently, statewide registered voter turnout fell from about 82% in 2018 to probably 75% in 2022. Judging whether turnout was “high” or “low” is all about the chosen baseline of comparison, and 2018’s turnout was notably high. In 2014, turnout was closer to 71%.Another complication is that the proportion of eligible voters who are registered may vary over time, based on both personal behavior and voter roll maintenance practices. For this reason, it’s best to consider both proportional and raw turnout trends.
The table below shows both kinds of turnout for the four-county Milwaukee metro. Turnout as a share of registered voters declined everywhere. It dropped by four points in Washington, six points in Ozaukee, seven points in Waukesha, and 11 points in Milwaukee. On the other hand, the number of ballots cast increased slightly everywhere outside Milwaukee County. Proportional turnout dropped because the number of registered voters grew even faster. Did the proportion of eligible voters who are registered change in the WOW counties? Unfortunately, we don’t know the answer.
| Turnout trends, 2018 to 2022 | |||||||||
| in Milwaukee metro counties | |||||||||
| turnout1 | ballots-cast | reg-voters2 | |||||||
|---|---|---|---|---|---|---|---|---|---|
| 2022 | 2018 | shift | 2022 | 2018 | shift | 2022 | 2018 | shift | |
| Washington | 81% | 85% | −4.3 | 74,531 | 70,845 | 3,686 | 92,142 | 83,175 | 8,967 |
| Ozaukee | 81% | 87% | −5.7 | 52,583 | 51,396 | 1,187 | 64,865 | 59,211 | 5,654 |
| Waukesha3 | 80% | 87% | −7.0 | 224,579 | 221,807 | 2,772 | 282,292 | 256,100 | 26,192 |
| Milwaukee | 69% | 79% | −10.5 | 350,905 | 397,189 | −46,284 | 510,015 | 501,143 | 8,872 |
| 1 ballots cast as a share of registered voters | |||||||||
| 2 registered voter count reported in the unofficial returns, which does not include all election day registrants | |||||||||
| 3 Total ballots cast is not available for Waukesha, so the highest individual-race vote total is used. Waukesha registered voter counts are taken from Nov. 1 totals. | |||||||||
In the city of Milwaukee, however, turnout dropped by both measures. The share of registered voters casting a ballot fell by 11 points and the number of ballots cast dropped by some 36,000. This significant drop in voter turnout occurred across the entire city. Only a handful of wards saw voter turnout increase. (To make direct ward comparisons post-redistricting, I allocated votes from 2018 wards into 2022 boundaries based on adult population overlap).
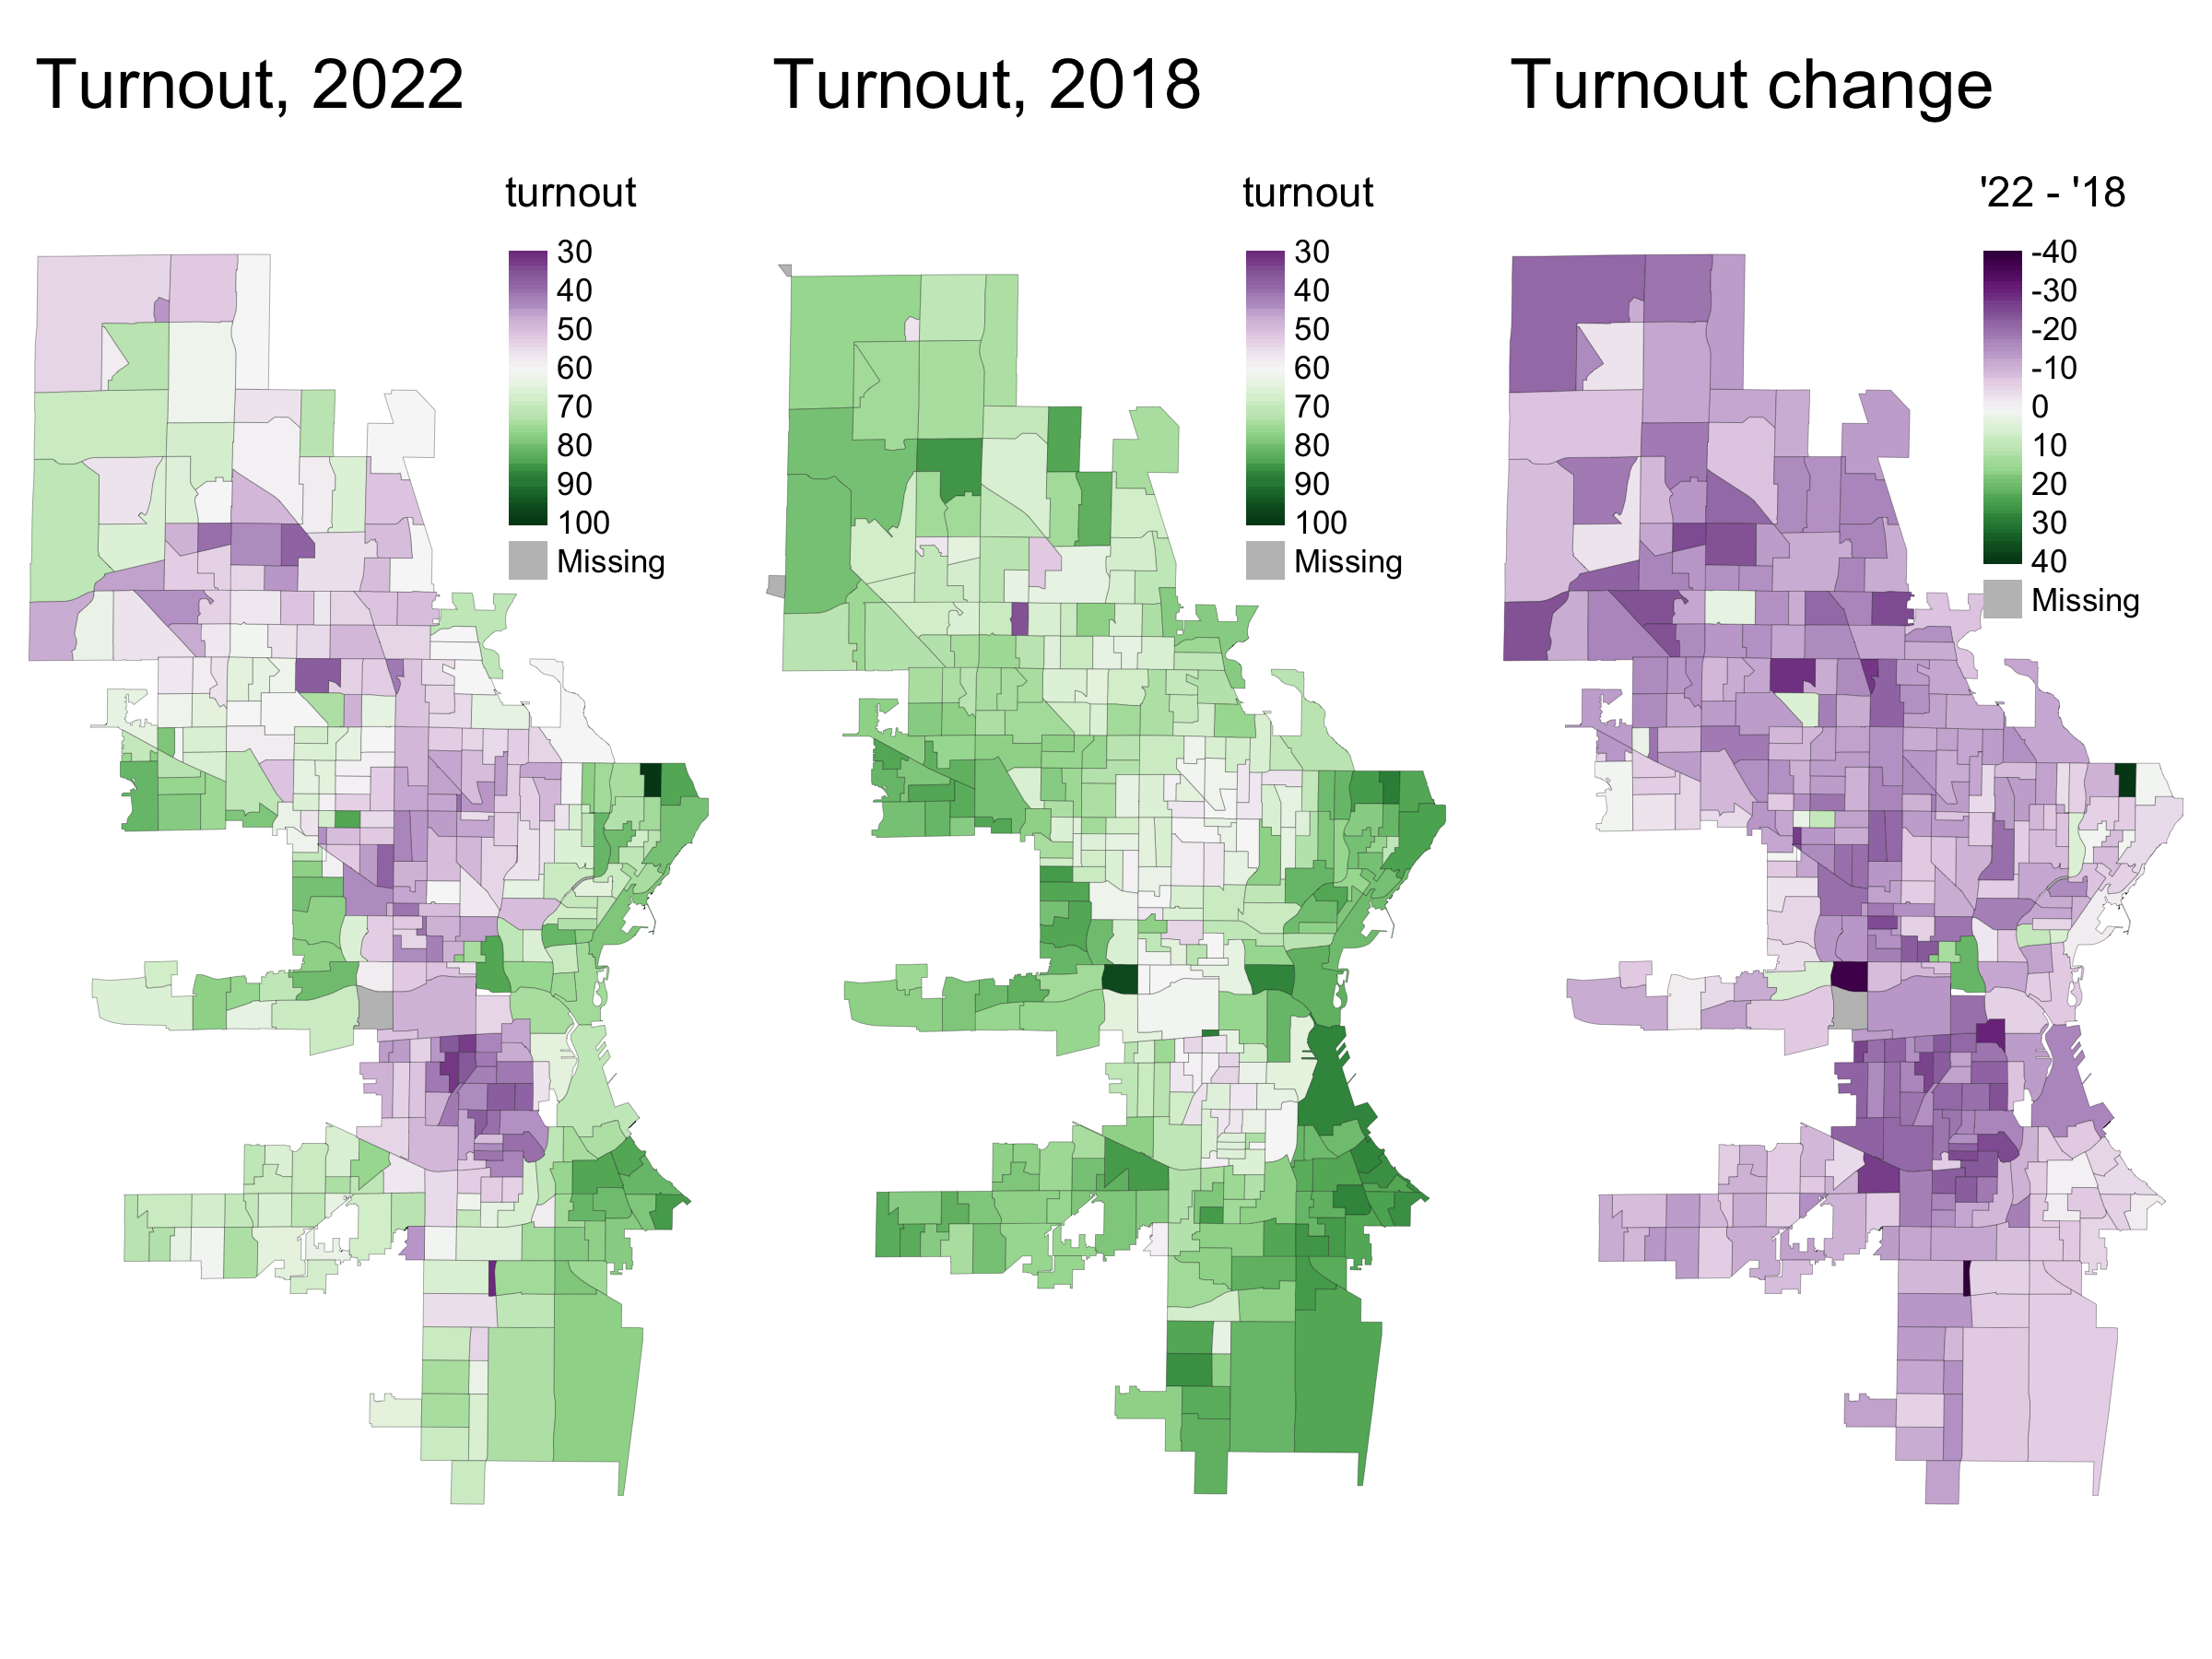
City of Milwaukee wards, turnout as a share of registered voters in 2018 and 2022. Image by John D. Johnson.
Turnout declined in each aldermanic district. The largest drop came in the eighth district (the western portion of the near South Side) where turnout fell to 49%, down from 68% in 2018. The smallest decrease came in the 4th district (Downtown and the Near West Side) where turnout was 69%, down from 73% in 2018.
Even as turnout declined, Evers’ share of the vote improved almost everywhere. He improved his vote margin by 13 points in the third district (East Side and Riverwest), 11 points in the fourth, and 10 points in the 14th (Bay View). The near south side (eighth and 12th districts) shifted marginally toward the Republicans, and the extremely Democratic first, second, seventh and 15th districts saw essentially no change in their vote margins.
| Voting statistics for Milwaukee Aldermanic Districts, 2018 and 2022 gubernatorial elections | ||||||||||||
| aldermanic districts | dem margin | turnout | reg voters | ballots | ||||||||
|---|---|---|---|---|---|---|---|---|---|---|---|---|
| 2022 | 2018 | shift | 2022 | 2018 | shift | 2022 | 2018 | shift | 2022 | 2018 | shift | |
| 1 | 85.6% | 85.1% | 0 | 55.7% | 70.4% | −15 | 19,355 | 20,759 | −1,404 | 10,785 | 14,612 | −3,827 |
| 2 | 80.1% | 78.6% | 1 | 55.4% | 69.1% | −14 | 18,633 | 19,673 | −1,040 | 10,315 | 13,602 | −3,287 |
| 3 | 74.5% | 61.7% | 13 | 74.5% | 80.1% | −6 | 23,845 | 25,234 | −1,389 | 17,767 | 20,209 | −2,442 |
| 4 | 61.2% | 49.9% | 11 | 68.5% | 72.7% | −4 | 18,741 | 19,639 | −898 | 12,842 | 14,277 | −1,435 |
| 5 | 52.9% | 43.4% | 9 | 66.7% | 77.6% | −11 | 22,687 | 22,403 | 284 | 15,122 | 17,380 | −2,258 |
| 6 | 89.0% | 86.4% | 3 | 56.7% | 68.0% | −11 | 20,083 | 21,482 | −1,399 | 11,386 | 14,616 | −3,230 |
| 7 | 87.1% | 87.6% | 0 | 58.5% | 70.4% | −12 | 19,981 | 21,430 | −1,449 | 11,694 | 15,081 | −3,387 |
| 8 | 58.9% | 60.4% | −1 | 49.5% | 68.2% | −19 | 11,877 | 11,811 | 66 | 5,877 | 8,055 | −2,178 |
| 9 | 66.9% | 62.5% | 4 | 60.4% | 74.0% | −14 | 18,489 | 18,731 | −242 | 11,172 | 13,856 | −2,684 |
| 10 | 56.5% | 47.6% | 9 | 69.3% | 77.8% | −8 | 21,122 | 21,309 | −187 | 14,639 | 16,577 | −1,938 |
| 11 | 18.1% | 12.5% | 6 | 68.0% | 77.8% | −10 | 21,505 | 20,933 | 572 | 14,614 | 16,291 | −1,677 |
| 12 | 66.0% | 67.1% | −1 | 48.6% | 65.1% | −17 | 11,641 | 11,508 | 133 | 5,656 | 7,494 | −1,838 |
| 13 | 27.9% | 20.8% | 7 | 67.5% | 78.6% | −11 | 19,745 | 19,282 | 463 | 13,337 | 15,156 | −1,819 |
| 14 | 59.6% | 49.3% | 10 | 72.9% | 81.6% | −9 | 22,702 | 22,302 | 400 | 16,551 | 18,201 | −1,650 |
| 15 | 90.2% | 90.0% | 0 | 49.9% | 63.5% | −14 | 15,901 | 17,536 | −1,635 | 7,938 | 11,129 | −3,191 |
| 2018 statistics were reallocated into 2022 boundaries using adult population overlap in the 2020 census. In both elections, the number of registered voters reported on the unofficial election night returns is used. This does not include all the election day registrations. | ||||||||||||
Within Milwaukee County, the city is not an outlier. Every municipality in the county saw its proportional turnout decline, ranging from a one-point drop in River Hills to a 16-point drop in West Milwaukee. For the county, Milwaukee’s 11-point decline is about average. The raw number of ballots cast declined in every municipality, except for a trivial increase in Fox Point.
| Turnout trends, 2018 to 2022 | |||||||||
| in Milwaukee county municipalities | |||||||||
| turnout1 | ballots-cast | reg-voters2 | |||||||
|---|---|---|---|---|---|---|---|---|---|
| 2022 | 2018 | shift | 2022 | 2018 | shift | 2022 | 2018 | shift | |
| V. River Hills | 85% | 86% | −1.1 | 1,060 | 1,093 | −33 | 1,253 | 1,276 | −23 |
| V. Whitefish Bay | 84% | 89% | −5.1 | 8,704 | 8,724 | −20 | 10,414 | 9,834 | 580 |
| V. Fox Point | 84% | 90% | −5.8 | 4,398 | 4,322 | 76 | 5,239 | 4,816 | 423 |
| C. Franklin | 80% | 87% | −7.4 | 18,075 | 18,461 | −386 | 22,727 | 21,225 | 1,502 |
| V. Hales Corners | 79% | 86% | −7.6 | 3,825 | 3,983 | −158 | 4,856 | 4,611 | 245 |
| V. Bayside | 77% | 86% | −8.5 | 2,607 | 2,728 | −121 | 3,370 | 3,176 | 194 |
| C. Glendale | 80% | 89% | −9.3 | 7,405 | 7,720 | −315 | 9,281 | 8,664 | 617 |
| C. Wauwatosa | 80% | 89% | −9.7 | 26,704 | 27,572 | −868 | 33,481 | 30,824 | 2,657 |
| C. Oak Creek | 76% | 86% | −9.9 | 16,180 | 16,387 | −207 | 21,158 | 18,967 | 2,191 |
| V. Shorewood | 81% | 91% | −10.2 | 7,923 | 8,310 | −387 | 9,773 | 9,107 | 666 |
| C. Milwaukee | 63% | 74% | −10.9 | 179,756 | 216,537 | −36,781 | 286,329 | 294,032 | −7,703 |
| C. St. Francis | 78% | 89% | −11.1 | 4,701 | 4,791 | −90 | 6,035 | 5,381 | 654 |
| V. Greendale | 77% | 89% | −11.5 | 7,720 | 8,197 | −477 | 9,986 | 9,232 | 754 |
| C. Greenfield | 76% | 88% | −11.6 | 16,543 | 17,722 | −1,179 | 21,746 | 20,223 | 1,523 |
| C. South Milwaukee | 73% | 86% | −12.6 | 8,504 | 9,343 | −839 | 11,606 | 10,880 | 726 |
| C. Cudahy | 69% | 83% | −13.8 | 7,320 | 7,987 | −667 | 10,550 | 9,600 | 950 |
| C. West Allis | 69% | 84% | −14.9 | 22,460 | 25,451 | −2,991 | 32,453 | 30,268 | 2,185 |
| V. Brown Deer | 73% | 88% | −14.9 | 5,853 | 6,465 | −612 | 7,990 | 7,331 | 659 |
| V. West Milwaukee | 66% | 82% | −16.3 | 1,167 | 1,396 | −229 | 1,768 | 1,696 | 72 |
| 1 ballots cast as a share of registered voters | |||||||||
| 2 registered voter count reported in the unofficial returns, which does not include all election day registrants | |||||||||
None of this will keep Wisconsin Democrats from lamenting what might have been. Mandela Barnes lost his senate bid by fewer than 28,000 votes statewide. He won 80.6% in the city. If Milwaukee’s turnout had hit its 2018 level, and if those additional voters gave Barnes the same level of support, that would have added close to 29,000 to his tally. But if Milwaukee’s turnout had been higher, it surely would have likewise increased in the Republican-leaning parts of the state.
Also, Milwaukee’s turnout was not out of the ordinary. This year’s 63% turnout rate is much lower than the 74% we experienced in 2018, but 2018 was unusually high. According to the city’s archives, turnout as a share of registered voters was 66% in 2014, 62% in 2010, 57% in 2006, and 42% in 2002. Milwaukee’s turnout decline was consistent with patterns elsewhere in the state and past midterm elections.
John D. Johnson is a Research Fellow in the Marquette University Law School Lubar Center for Public Policy Research and Civic Education, where he specializes in applying research practices from academia and data science to pressing policy issues facing Milwaukee and Wisconsin. Areas of focus include housing, demographics, and political trends.
If you think stories like this are important, become a member of Urban Milwaukee and help support real, independent journalism. Plus you get some cool added benefits.


What an impressive catalog of results. Thanks for the UM
Thanks for providing this analysis and context, John.
Thanks John, this helped a lot as I am still in deep mourning for Mandella’s close loss.
What’s it going to take to get more people out to vote? Despite the incredible efforts of groups like Souls to the Polls, BLOC, LIT, Voces de la Frontera, and the Grassroots groups, the turnout in MKE dropped? A significant fraction of our eligible population doesn’t believe government can serve their needs. The Dems need to wake up.