Trump’s “Big Lie” Vs The Election Data
The story in Wisconsin and nationally could not have been clearer.

Joe Biden and Donald Trump.
Repeated polling suggests that a majority of Republican voters continue to believe Trump’s “Big Lie,” the claim that he won the 2020 election, and that it was stolen from him. It seems that no amount of contrary evidence will shake the faith of those in the Trump cult.
Which is curious given how crystal clear the results of the election were. Both major candidates received substantially more votes in 2020 than in 2016. But, except in a handful of states, the increase in Trump’s vote lagged behind that for Joe Biden compared to Clinton in 2016.
This pattern was widespread throughout the nation, in most red states and most blue states. But in most cases the magnitude was insufficient to convert a red state into a blue state (or vice versa).
But in Wisconsin and four other competitive states (Arizona, Georgia, Michigan and Pennsylvania), that national trend, of a greater increase in the Democratic vote, was enough to push all five states from the Republican to the Democratic column in the presidential vote.
In 2020, over 157 million Americans voted for one of the two major candidates for president, Biden or Donald Trump. Compared to the 2016 presidential vote, this was an increase of about 13.7% in the number of voters.
In 2016, Hillary Clinton’s vote total was almost 3 million more than Trump’s, but because the Electoral College favors voters in small states, Trump was elected president. In 2020, Biden received almost 7 million more votes than Trump.
The graph below, taken from an earlier column, compares the percentage of the vote that Clinton won in 2016, on the horizontal axis, to that won by Biden in 2020, on the vertical axis. (For simplicity, throughout this analysis I used the percentage of the major party vote, dropping third party and write-in voting. Thus, Trump’s percentage is the difference between the Clinton or Biden vote and 100%.)
Two observations can be made about this graph. The first is that it shows the remarkable stability of the vote from election to election. The best predictor of who would win a state in 2020 is who won in 2016. This is quantified by the coefficient of determination (R2) of .984. This is interpreted as saying that 98% of the variation in 2020 results is explained by the variation of 2016 results.
The second is that, while both candidates received more votes in 2020 than in 2016, in most states Biden’s vote grew more than Trump’s. This can be seen by comparing the red diagonal line to the dotted trend line. In states shown above the red line, Biden’s vote increase would have exceeded Trump’s.
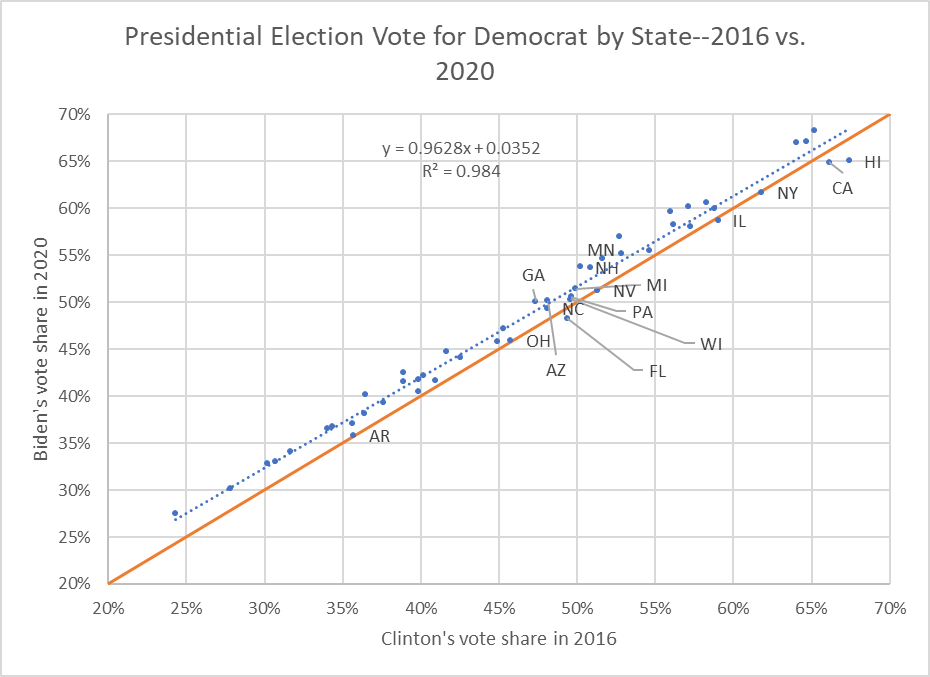
Presidential Election Vote for Democrat by State–2016 vs. 2020
The next chart makes this even more clear. In only six states did Trump improve his share of the vote total. In at least two of these—California and Florida—this may reflect a decline in Democratic support among Hispanic voters.
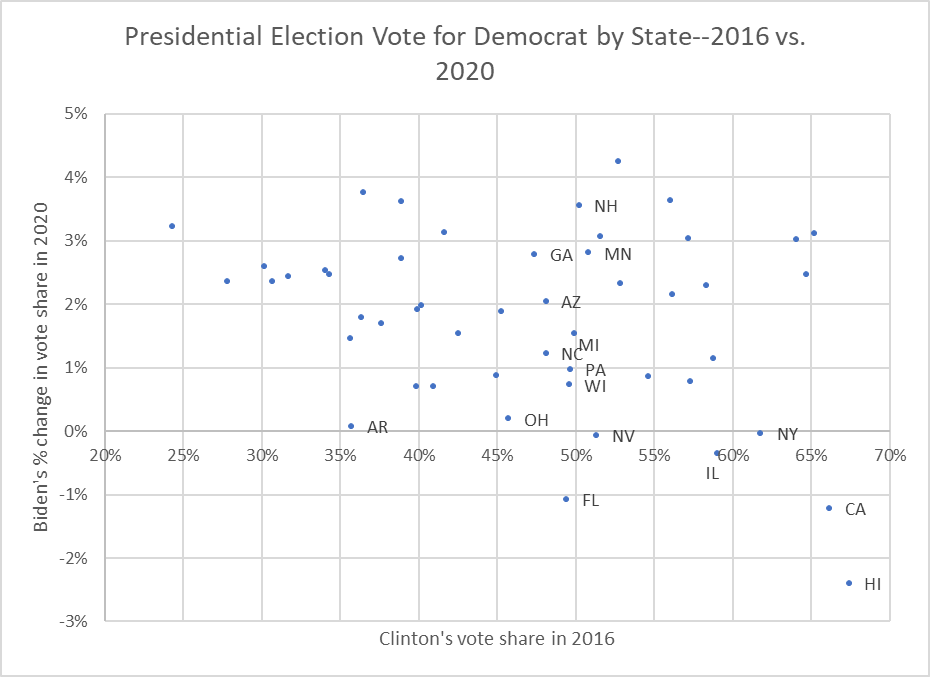
Presidential Election Vote for Democrat by State–2016 vs. 2020
If there were an attempt to illegally inflate the Biden vote, depress the Trump vote, or switch votes from Trump to Biden, one would expect it to be concentrated in competitive states. The large number of states shown on the left of the chart above are safely Republican. Likewise, the dots on the right represent states that are safely Democratic. To spend funds and risk prosecution to try to subvert voting in these states would make little sense. Thus, any attempt to steal the election would likely target the small group of competitive states.
The graph below summarizes the big story about the 2020 election: both candidates got more votes in 2020 than they did in 2016. However, the Trump increase was smaller than the Clinton to Biden increase. This generalization is true for the nation as a whole, for safely red states, for safely blue states, and for a small group of competitive states. The latter include the five states, including Wisconsin, that flipped from Trump in 2016 to Biden in 2020, plus Nevada.
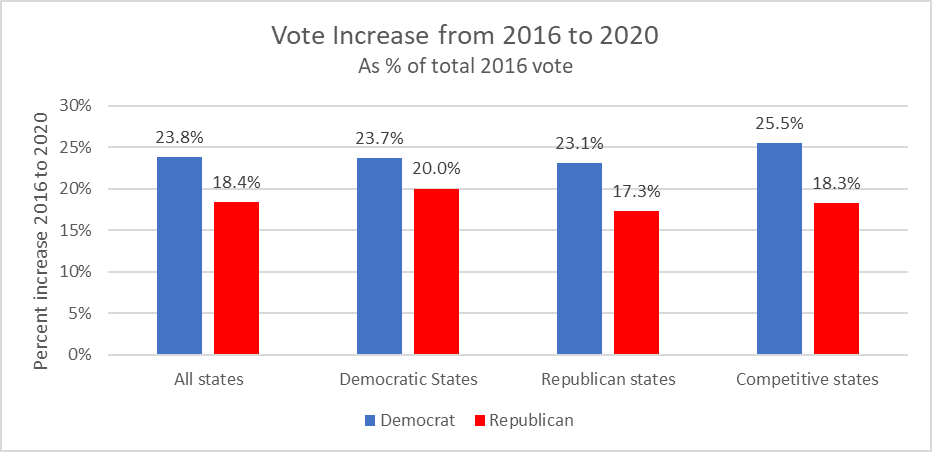
Vote increase from 2016 to 2020 as percent of total 2016 vote
Thus, Trump lost the presidency not due to some skullduggery, but because a majority of the voters rejected him. Rather than being a victim of fraud, Trump lost the 2020 election because the added voters in Wisconsin and other competitive states shared the preference of Biden over Trump, just like most voters in noncompetitive states.
If you think stories like this are important, become a member of Urban Milwaukee and help support real, independent journalism. Plus you get some cool added benefits.
Data Wonk
-
Who Do You Trust to Conduct Elections Fairly?
 Apr 6th, 2026 by Bruce Thompson
-
Is Non-Citizen Voting a Real Threat to Elections in Wisconsin?
Mar 18th, 2026 by Bruce Thompson
-
How Global Climate Change Affects Milwaukee
 Mar 11th, 2026 by Bruce Thompson