
Measuring The Redistricting Plans
Which map is fairest and most democratic? Here are the experts’ analysis.
Assembly Bill 624/Senate Bill 621
A healthy democracy depends on the ability of voters to participate in elections whose results reflect their preferences. For the past decade Wisconsinites have been denied that right. Gerrymandered legislative districts have assured that the state Legislature—particularly the Assembly—is overwhelming controlled by Republicans. This is true even though Wisconsin is famed as a competitive state, in which neither party can be assured of success in the next state-wide election.
Will Wisconsin return to the democratic norm, where the will of the people is reflected in the distribution of its state senators and Assembly members, as well as the representatives it sends to Congress? The answer depends on the district plan it adopts in the next few months.
To get a sense of the possible plans, I looked at a number of the maps that have been proposed, concentrating on two groups of maps. The first group is contained in two bills introduced by Republican members of the legislature. SB-621 would revise Wisconsin Assembly and Senate districts to incorporate the results of the 2020 Census. SB-622 would revise districts for the Wisconsin delegation to the U.S. House of Representatives.
The other group consists of draft maps issued by the Peoples Map Commission (PMC) established by Governor Tony Evers. The commission is a nonpartisan group of nine citizens from all eight of Wisconsin’s congressional districts.
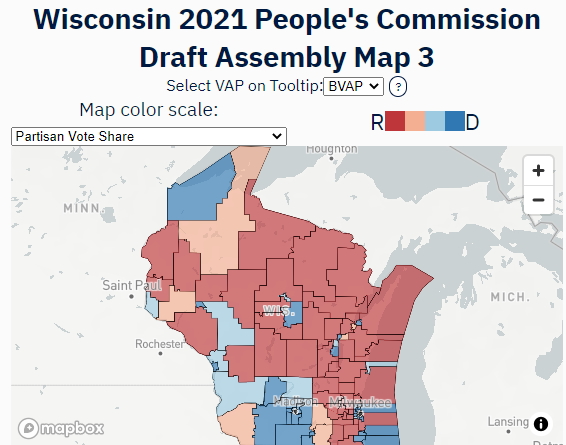
Wisconsin 2021 People’s Commission Draft Assembly Map 3
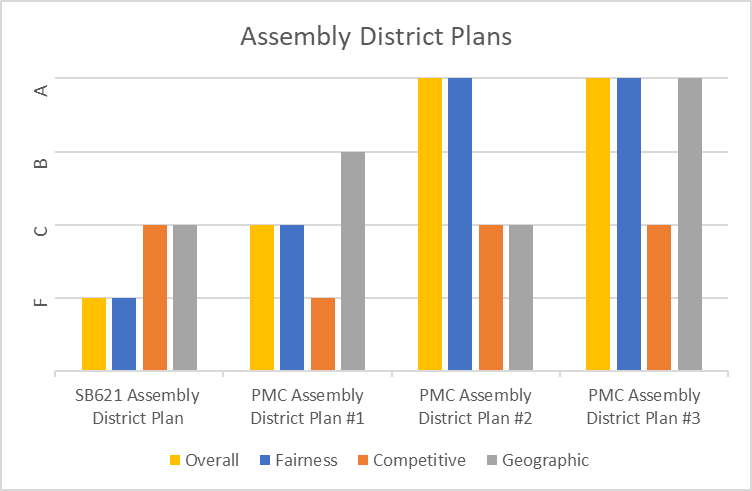
The Princeton Redistricting Project scores maps using three categories: partisan fairness, competitiveness, and geographic features. It also gives an overall grade. The grades, in order of increasing quality are F, C, B, and A.
The first graph below shows the PRP ratings for four plans to redistrict the Assembly: that contained SB-621 and three drafts from the People’s Commission.
On fairness, which rates whether that the resulting bodies accurately reflect the will of the voters, SB-621 is given an F because it gives a “significant Republican advantage.” On competitiveness, reflecting the number of competitive districts, it is given a C, because it is “similarly competitive relative to other maps that could have been drawn.” On geography, the map rates an F for “non-compact districts, more county splits than typical.”
PMC draft number 1 rates a C on partisan fairness for a “slight Democratic advantage” and that it “advantages incumbents.” It gets an F in competitiveness for being “very uncompetitive relative to other maps that could have been drawn.” On geographic features, it rates a B for “very compact districts, typical number of county splits.”
The second plan from the PMC rates somewhat better. On partisan fairness it rates an A—the plan gives “no advantage” to either party. On the other two measures it gives a C (“Average for the category, could be better, but also could be worse”).
The third PMC map rates even better. It gets three A’s, including for geographic features for “very compact districts, few county splits.”
Assembly District Plans
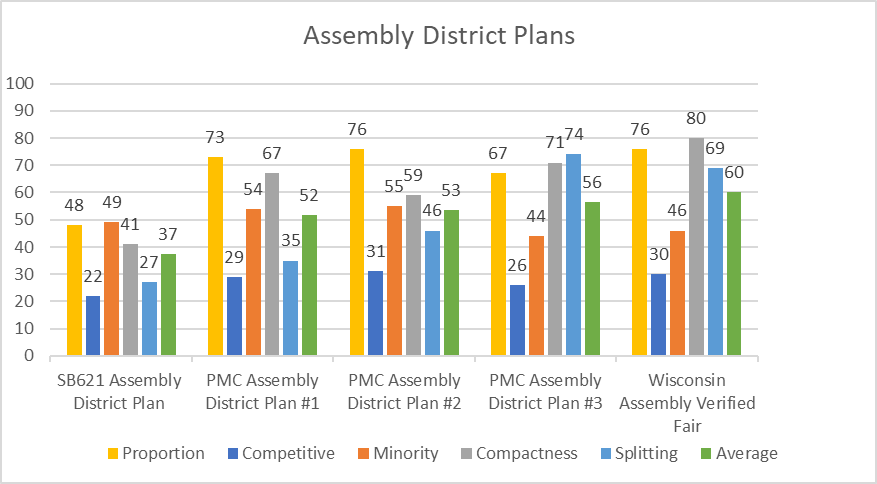
Dave’s Redistricting (DRA) is a web site that analyzes proposed electoral maps that are uploaded to it. It has also analyzed the adopted 2010 state electoral maps, using data from the 2010 and 2020 censuses and results from a number of elections in the past decade. It uses five measures to analyze plans:
- Proportionality: are the number of seats won proportional to the vote? This measure seems very similar to the “Fairness” measure used by PRP.
- Competitive: based on the percentage of districts that are close to an even split.
- Minority representation: does the map give minorities more opportunities to elect representatives?
- Compactness: generally calculated by comparing the perimeter of the district to the circumference of a circle surrounding the district.
- Splitting: when counties split districts and districts split counties.
In addition to these five, Dave’s Redistricting imposes four requirements on plans: that all precincts are assigned to districts, that all precincts in districts are connected, that no districts are embedded in others, and that districts have roughly equal populations. Judging from the number of maps that have been submitted to the website, Dave’s has struck a chord.
The next graph illustrates the analysis of the same four maps of revised Assembly districts—the SB-621 map and the three draft maps issued by the People’s Map Commission. Surprisingly, I could not find either the Republican legislators’ maps or those of the PMC on Dave’s site. I downloaded the SB-612 maps from the Republican legislature’s mapping website and the PMC maps from the Princeton Gerrymandering Project website and submitted them.In addition, the graph includes one of the plans submitted by the public, called, called “Wisconsin Assembly Verified Fair.” As the name suggests, it scored well particularly on compactness and proportionality.
Defenders of the current 2010 district map sometimes argue that the geography of Wisconsin forces their hand, that to meet the other requirements of redistricting—compactness, respecting political boundaries, etc., leaves them little ability to avoid favoring Republicans. A glance at the graph below should disabuse anyone of that notion. Not only is the Republicans’ map the worst in fairness and proportionality, it is also the worst on almost every other measure.
Assembly District Plans
The next four charts repeat this analysis for the state senate and Wisconsin’s congressional delegation. First is the Princeton Gerrymandering analysis of four state senate maps.
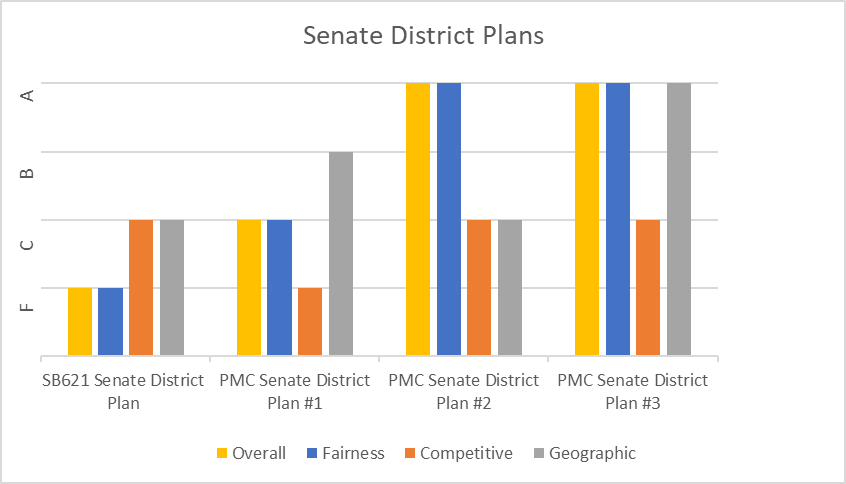
Senate District Plans
The analysis using Dave’s Redistricting is shown below. As before, all the PMC’s draft maps score substantially better on proportionality than does the plan in SB-621. A likely explanation is that in redistricting the Senate, the designers are severely constrained by the requirement that each senate seat consist of three Assembly districts. The only decision is which three Assembly districts to put into each Senate seat.
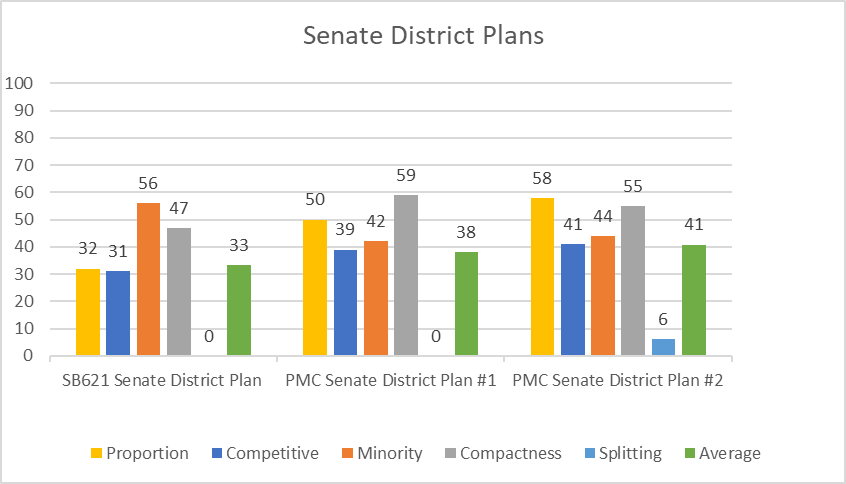
Senate District Plans
As to congressional districts, here is the PRP analysis:
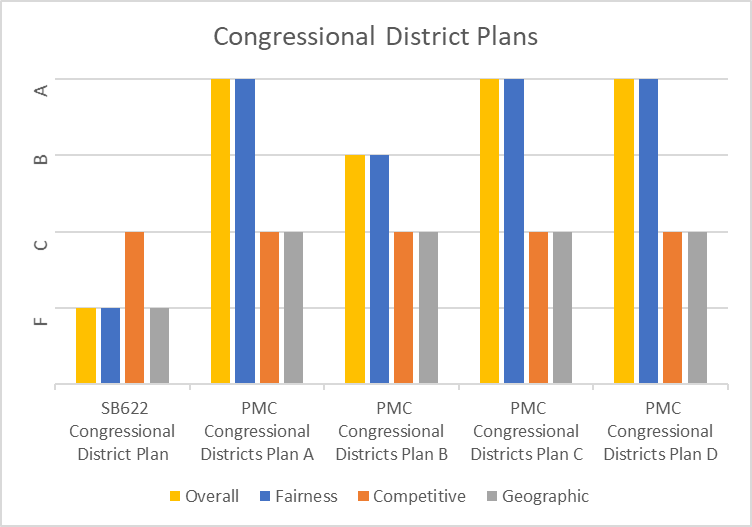
Congressional District Plans
Here are some maps seen through the eyes of Dave’s Redistricting. The discrepancy between the proportionality of SB 622 and that of the People’s Commission plan D is particularly striking. It could easily result in only two of Wisconsin’s eight representatives being Democrats. No doubt, the Republican sponsors of SB-622 will insist that this result had no influence on the map’s design.
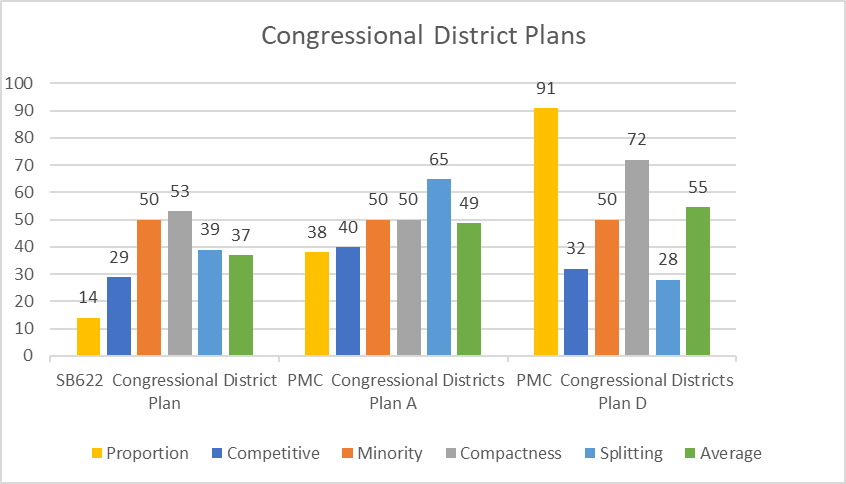
Congressional District Plans
Neither the PMP nor Dave’s include preserving so-called “communities of interest” COI) as part of their evaluation. Yet half the states, including Wisconsin, list COI in their redistricting laws. The People’s Map Commission puts its criteria into four tiers. COI is placed in the second tier.
By contrast, it classifies partisan fairness as a fourth order criterion, dismissing it with these comments:
Among the mapping plans that satisfy all higher priorities, a preference will be given for plans that tend to lead to proportional outcomes, defined as the share of representation for each party roughly equal to statewide share of support.
I would say that the PMP has it backwards: partisan fairness should be far more important than the poorly defined and impossible to measure communities of interest. In the PMP’s defense, however, its draft maps rate far higher in partisan fairness than those created by the Republican legislators.
Democracy is under attack not only around the world but also in Wisconsin. Rigging the vote rules to stay in power is increasingly accepted here. It is critically important that Wisconsin take the lead in reversing the trend.
More about the Gerrymandering of Legislative Districts
- Without Gerrymander, Democrats Flip 14 Legislative Seats - Jack Kelly, Hallie Claflin and Matthew DeFour - Nov 8th, 2024
- Op Ed: Democrats Optimistic About New Voting Maps - Ruth Conniff - Feb 27th, 2024
- The State of Politics: Parties Seek New Candidates in New Districts - Steven Walters - Feb 26th, 2024
- Rep. Myers Issues Statement Regarding Fair Legislative Maps - State Rep. LaKeshia Myers - Feb 19th, 2024
- Statement on Legislative Maps Being Signed into Law - Wisconsin Assembly Speaker Robin Vos - Feb 19th, 2024
- Pocan Reacts to Newly Signed Wisconsin Legislative Maps - U.S. Rep. Mark Pocan - Feb 19th, 2024
- Evers Signs Legislative Maps Into Law, Ending Court Fight - Rich Kremer - Feb 19th, 2024
- Senator Hesselbein Statement: After More than a Decade of Political Gerrymanders, Fair Maps are Signed into Law in Wisconsin - State Senate Democratic Leader Dianne Hesselbein - Feb 19th, 2024
- Wisconsin Democrats on Enactment of New Legislative Maps - Democratic Party of Wisconsin - Feb 19th, 2024
- Governor Evers Signs New Legislative Maps to Replace Unconstitutional GOP Maps - A Better Wisconsin Together - Feb 19th, 2024
Read more about Gerrymandering of Legislative Districts here
Data Wonk
-
Who Do You Trust to Conduct Elections Fairly?
 Apr 6th, 2026 by Bruce Thompson
-
Is Non-Citizen Voting a Real Threat to Elections in Wisconsin?
Mar 18th, 2026 by Bruce Thompson
-
How Global Climate Change Affects Milwaukee
 Mar 11th, 2026 by Bruce Thompson


Thanks for pulling this data together and reporting it. Ultimately it will be up to the courts? What does that pathway look like? Hadn’t there been law suites filled for the 2010 census? Would those cases have any impact?