What Is MPS Strategy For Stimulus Aid?
It's a huge opportunity to improve student achievement -- which is badly needed.
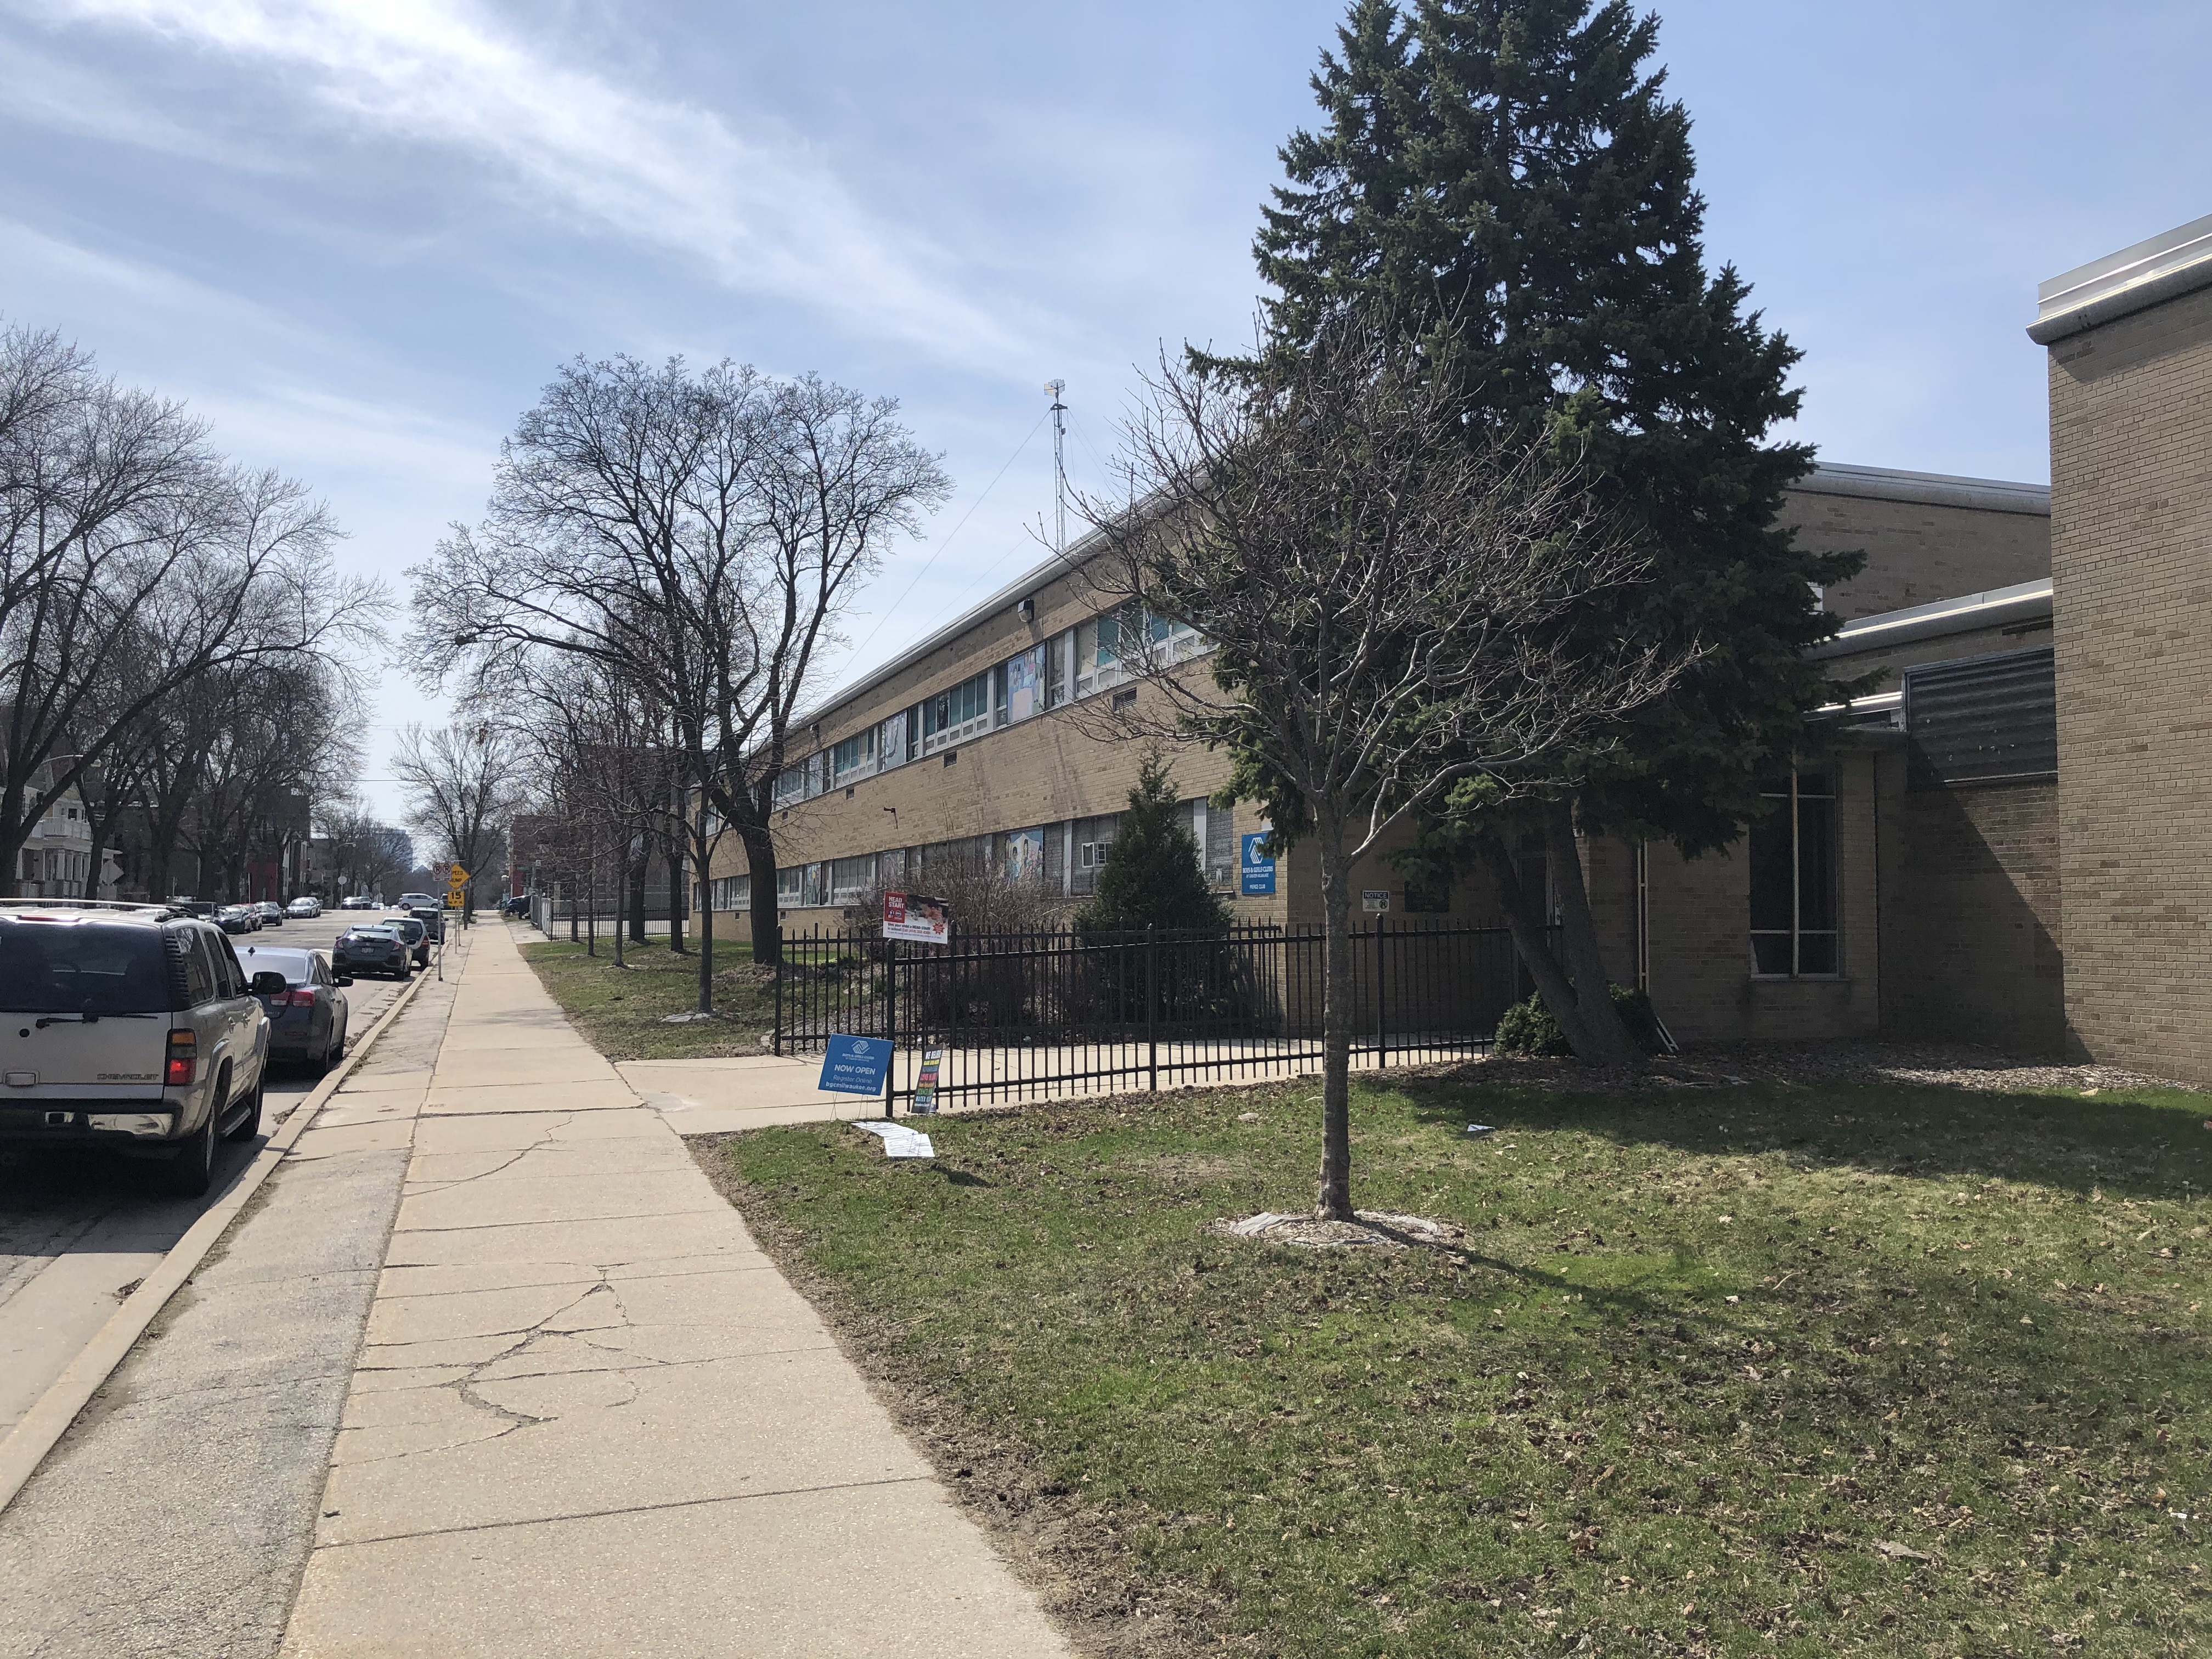
Riverwest Elementary School, 2765 N. Fratney St. File photo by Dave Reid.
The federal pandemic grants to Milwaukee Public Schools and other high-poverty school systems offer both a challenge and an opportunity for Milwaukee. In his comments on the grants, long-time education reporter Alan Borsuk commented that “districts using federal pandemic funds wisely may see more payoff in future.” The emphasis here is on “wisely.” When the money is spent, will we see a more effective MPS?
In distributing the money, Congress used the long-standing formula for Title 1 grants, which are based mainly on poverty in a school district. According to an April report from the Legislative Fiscal Bureau, the total going to Milwaukee is more than $500 million, or more than $7,000 per student.
The most affluent districts, including most Milwaukee suburbs are getting a few hundred dollars per student. A few high-poverty districts, such as Menominee Indian, get payments similar to Milwaukee’s.Assembly Speaker Robin Vos described the amount of federal money going to school districts as “overwhelming” and “really kind of obscene in many ways.” The new state budget limited spending on schools largely because Republicans thought the schools were already getting so much in federal aid.
Districts have three years to spend the grants, suggesting they should avoid long-term programs that would have to be cut when the money runs out.
Borsuk reports what MPS Superintendent Keith Posley told a Marquette Law School audience:
“Posley said areas expected to be increased include technology (every child should have a Chromebook computer in school and another at home, he said), textbooks, increased tutoring, more professional development for staff, more programs to help parents help their children, more extracurricular programs, and expanded summer school offerings a year from now. MPS is also spending huge amounts ($183 million even before this wave of money arrives) on improved air quality in schools.”
While many of these uses, such as improving school air quality, offer continued benefits after the money ends, others, such as increased extracurricular programs, seem to bring the danger of starting programs only to end them.
However, what I find particularly disturbing is the lack of any mention of using part of the funds to evaluate research on what works in education. Overall student achievement in MPS seems stuck. One piece of evidence for this conclusion is Milwaukee’s scores on the National Assessment of Educational Progress (NAEP), sometimes called the “Nation’s Report Card.” This test is given every two years to a random sample of 4th and 8th graders. Originally, the results were reported only for each state.
Starting in 2003, scores were also reported for several urban districts (participation is voluntary, so many cities are missing). Milwaukee joined the urban program in 2009, while skipping the 2015 assessment.The next four graphs show Milwaukee’s scores on four tests over the years. For comparison I chose Chicago, both because it is our nearest neighbor, because the populations appear to share similar characteristics, and because Chicago’s scores closely track those of the average urban district.
The first graph below shows the scores for the 4th grade reading assessment on the NAEP for Milwaukee (using solid lines) and Chicago (using dashed lines). Average scores are shown for the three largest ethnic groups: Blacks (in green), Hispanics (in red), and whites (in blue).
In 4th grade reading, Chicago students of all three ethnic groups scored higher than those in Milwaukee. In fact, Chicago students performed near the average of all 27 districts included in the assessment. Milwaukee, by contrast, performed near the bottom—only Detroit scored lower. The scores for Black and Hispanic students in MPS sharply decline on the most recent (pre-pandemic) test.
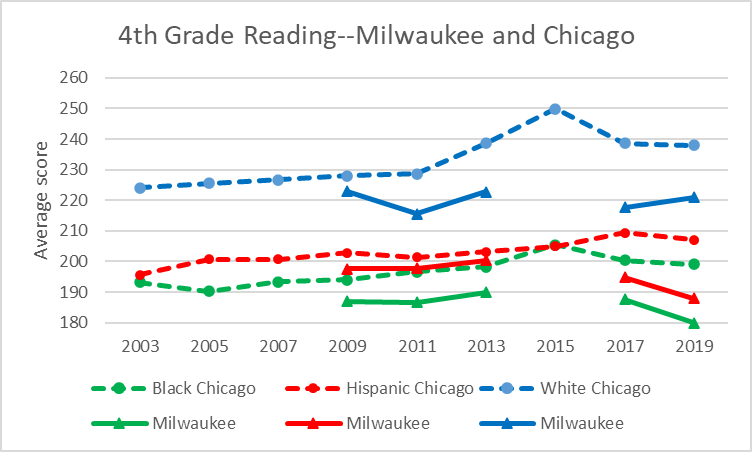
4th Grade Reading–Milwaukee and Chicago
Here are average 4th grade math scores. In many ways, the math pattern is similar to the reading pattern. As before, Chicago scores higher than Milwaukee and near the middle of all the urban districts. Milwaukee scores near the bottom. Over time, Chicago’s scores trend upward while Milwaukee’s have been stagnant.

4th Grade Math–Milwaukee and Chicago
The next two graphs show scores in reading and math for 8th graders. Again, Milwaukee scores seem stagnant over time, while there has some gain in Chicago. Again, Milwaukee scores are mostly flat except for a recent decline and are close to the bottom.
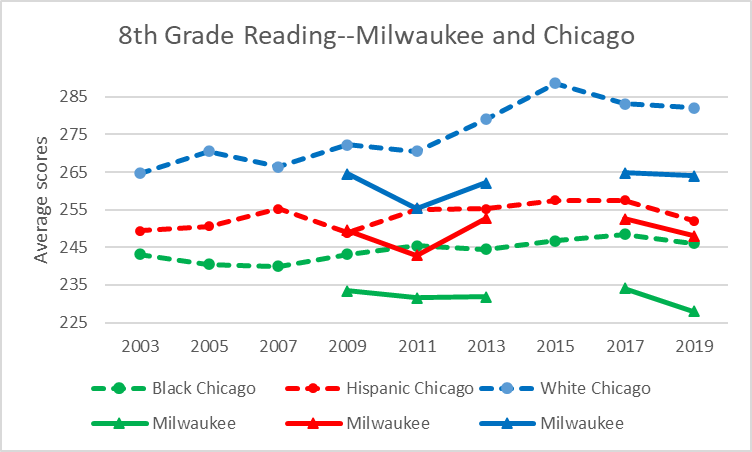
8th Grade Reading–Milwaukee and Chicago
Finally, here are the scores for 8th grade math. The story is much the same.
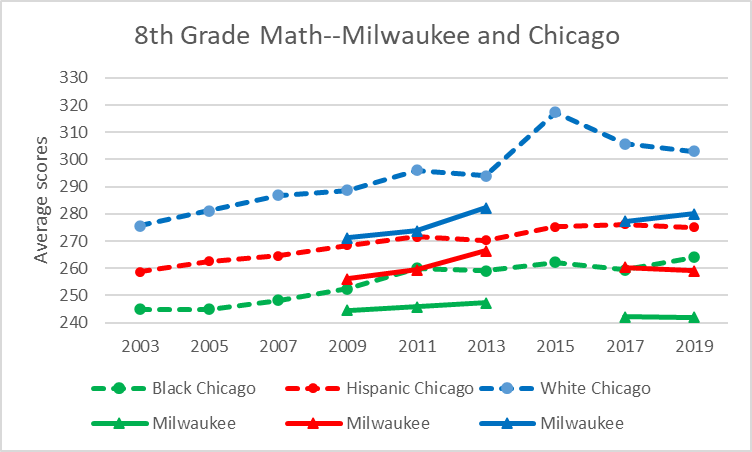
8th Grade Math–Milwaukee and Chicago
Overall, the NAEP results for Milwaukee show a district with flat or declining student achievement. They suggest a district that is stuck when it comes to student achievement.
The School Report Cards from the Wisconsin Department of Public Instruction tell a similar story. From year to year, some schools improve. However, this is offset by the decline of others.
The way to begin rising from the bottom, I believe, starts with identifying particularly successful MPS school and then identifying the factors behind that success. A few years ago, the Marvin Pratt School (under the name of Silver Spring School) had mediocre reading and math scores. The most recent School Report Card awarded Pratt the highest rating possible in math and reading growth.
But the effort at improvement should not stop at looking internally. There is a growing body of research on the effectiveness of various educational interventions. Much of this is bad research, motivated by profit or ideology or by some pre-perceived notion of what should work.Fortunately, there is a growing body of analytical ratings that attempts to separate good research from bad. Examples include a website called Social Programs that Work and the What Works Clearinghouse, part of the Department of Education’s Institute of Education Sciences.
Good education research is hard. There are several reasons for this. First, in contrast to much medical research including measuring vaccines’ effectiveness, most educational interventions don’t lend themselves double blind random sampling. In the case of a class-size study, for instance, the teachers at least will be very aware of whether they are part of the treatment group or of the control.
Of all possible interventions, vaccines would appear to be among the least likely to elicit a response from political partisans. Yet, we have just seen how easily they can be partisan. Compared to vaccines, education interventions are often accompanied by labels designed to elicit a positive response from people of a particular ideological bent. So care must be taken to avoid pre-determined and charged terms.
A final—and perhaps most serious—obstacle to MPS using research to become more effective may be the board itself. Will they be able to put aside their prior beliefs and judge possible interventions on evidence of effectiveness? It’s critically important that they do so. To continue with business as usual is to risk spending this windfall of funding with no long-term improvement to show for it, vindicating Robin Vos’ cynicism.
Data Wonk
-
Who Do You Trust to Conduct Elections Fairly?
 Apr 6th, 2026 by Bruce Thompson
-
Is Non-Citizen Voting a Real Threat to Elections in Wisconsin?
Mar 18th, 2026 by Bruce Thompson
-
How Global Climate Change Affects Milwaukee
 Mar 11th, 2026 by Bruce Thompson