
Trump Country Has Much Lower GDP
Yet the difference is smaller in Wisconsin. Why?
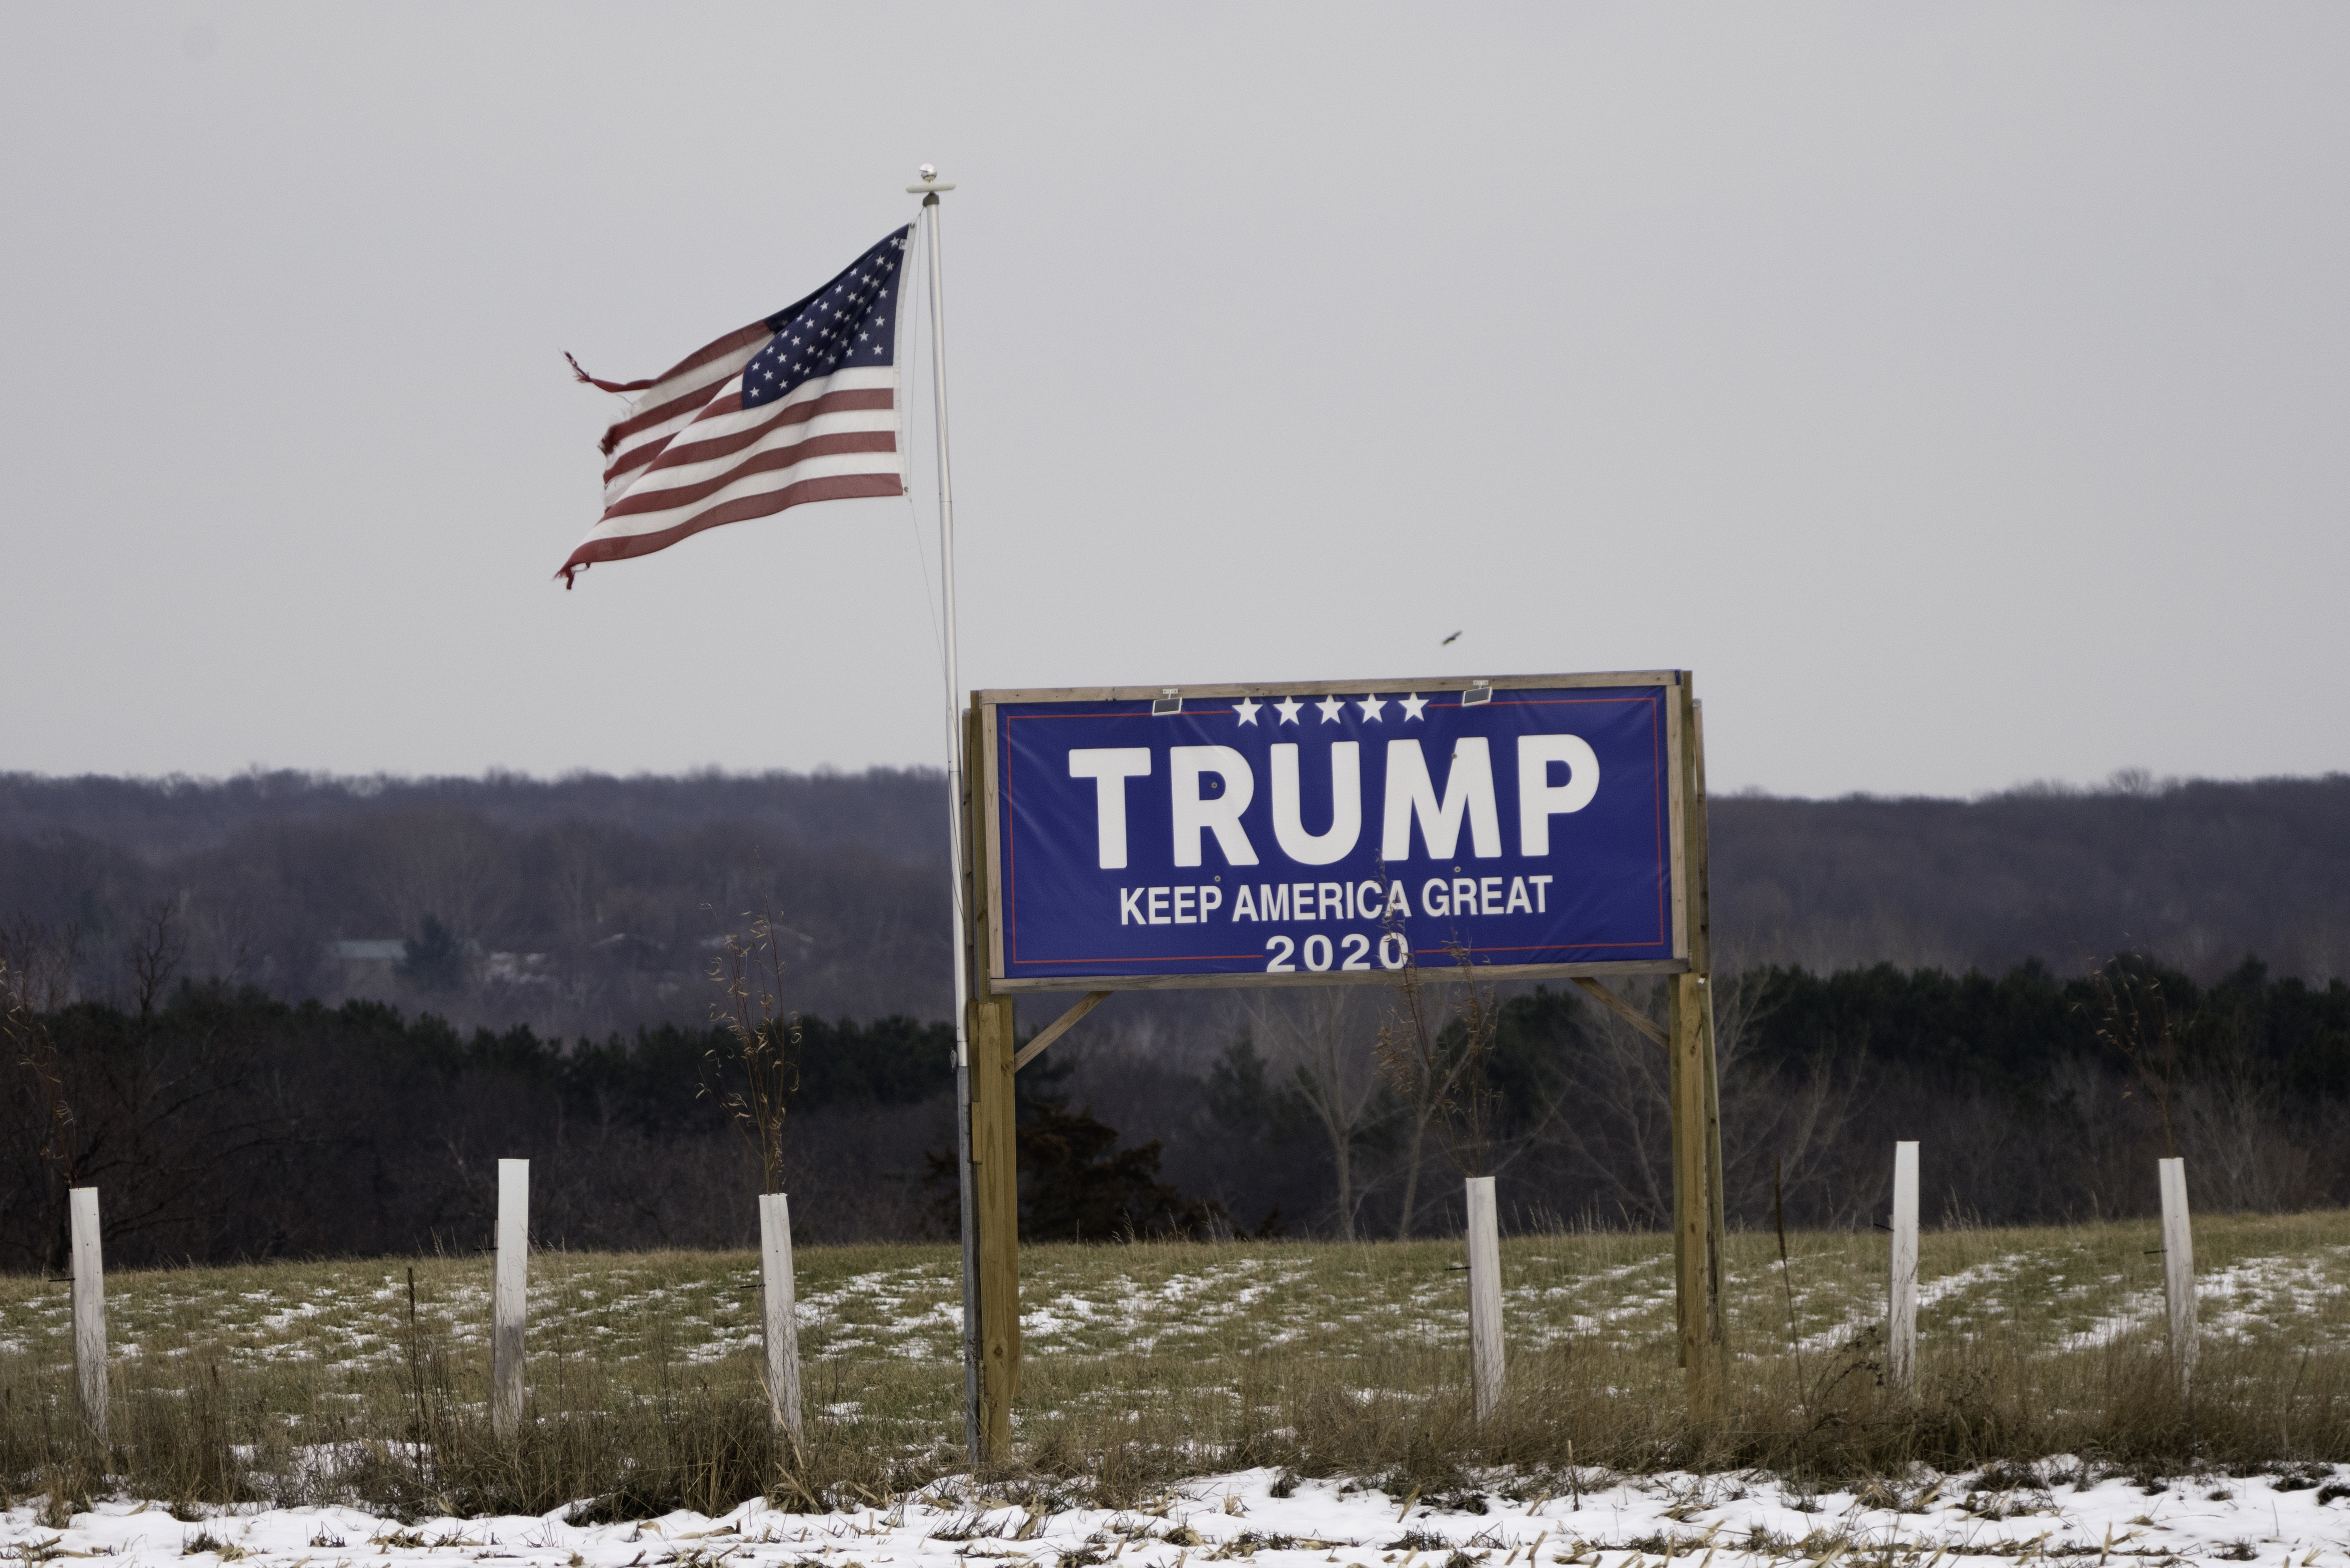
A Trump sign and torn US flag flying after the election near St Croix Falls, Wisconsin. Photo by Lorie Shaull from St Paul, United States, (CC BY-SA 2.0), via Wikimedia Commons
Following the 2016 election, a team at the Brookings Institution crunched the numbers and reported a remarkable conclusion: “that the 2,584 counties that Trump won generated just 36% of the country’s economic output, whereas the 472 counties Hillary Clinton carried equated to almost two-thirds of the nation’s aggregate economy.”
Following the 2020 presidential election, the Brookings team repeated their analysis and found that the Trump country’s share of national gross domesticate product (GDP) had shrunk to 29%. As the graph below shows, using the Brookings approach, I confirmed their results. Counties voting for Trump, according to my calculation, accounted for about 30% of GDP. (I excluded three states—Alaska, Hawaii, and Virginia—in which the political subdivisions used to report county votes do not match those used to report GDP.)

GDP for counties won by Trump and Biden for US (Trillions of $ and percentages)
Does the same pattern—that majority Joe Biden counties account for a disproportionate share of national GDP—apply to Wisconsin? The answer is no. The next chart shows that majority Trump counties accounted for about the majority — fully 57% — of Wisconsin’s GDP.
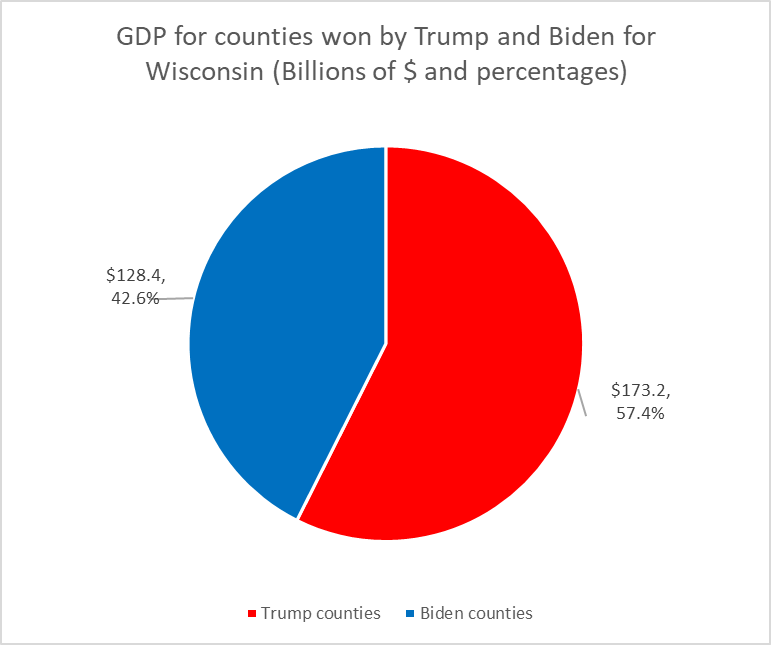
GDP for counties won by Trump and Biden for Wisconsin (Billions of $ and percentages)
One contributor to this apparent contradiction is the difference in the number of voters living in counties won by Trump and those in counties won by Biden. As the next graph shows, substantially more Wisconsin voters live in red counties—those carried by Trump—than in blue counties. Nationally, the story is the opposite. This population discrepancy helps explain why the Brookings model finds a large Democratic GDP advantage nationally but not in Wisconsin.
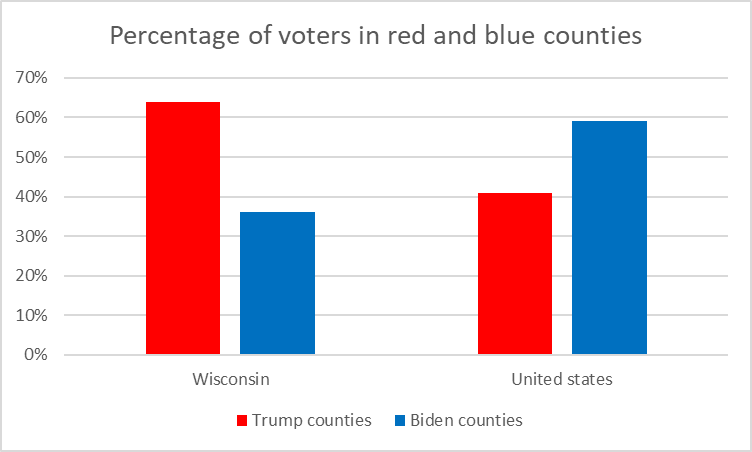
Percentage of voters in red and blue counties
The next two graphs address the question of where each candidates got his votes—from counties he won versus those he lost. Nationally, as the next graph shows, Biden won most of his votes in the counties he carried. In fact, almost three fourth of his vote — 73% — came from those counties.
By contrast, while Trump also got more votes in the counties he carried, only 55% of his votes came from those counties.
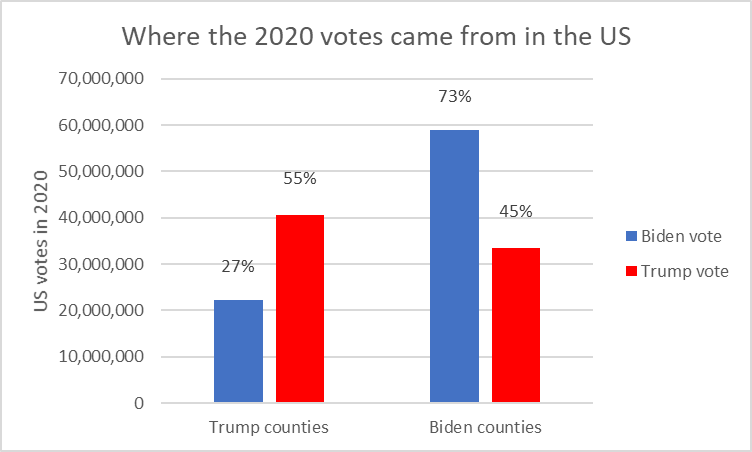
Where the 2020 votes came from in the US
Wisconsin’s story is quite different. As the graph below shows, Biden won slightly more votes — 52% — in counties he lost than in the counties he carried. By contrast, three-fourths of Trump’s votes — 76% — came from the counties he won.
Driving around Wisconsin prior to the 2020 election and counting lawn signs, one could easily get the impression that, outside a handful of cities, Biden had no support. Yet even in Taylor County, Wisconsin’s Trumpiest, Biden received 26% of the two-candidate vote.
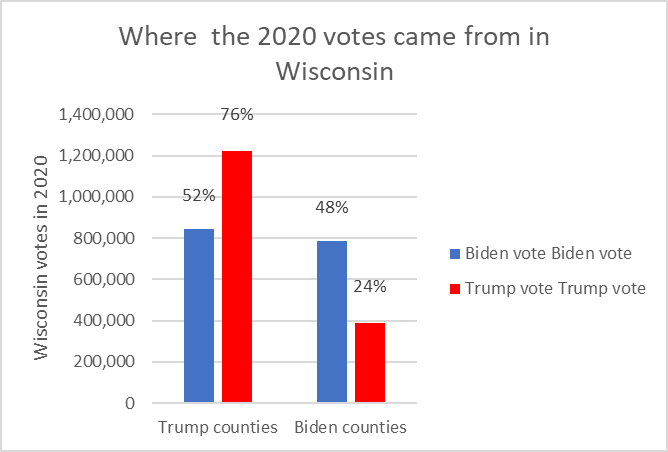
Where the 2020 votes came from in Wisconsin
This presents a challenge for Wisconsin Democrats: success in statewide races–and in the presidential election given Wisconsin’s importance in the electoral college–depends on votes from people in predominantly Republican neighborhoods. Yet most Democratic officeholders, particularly those in the Assembly, will represent urban districts. People considering running for office in counties that Trump won may decide that the chances of winning are too small.
The question for Democrats, therefore, is who will speak for that critical minority of Democratic voters in GOP-dominated counties when the prospects of success in winning races in those counties is remote. This challenge is made worse by gerrymandering that not only assures that Democrats are a minority of legislators but also that few of that minority represent Wisconsin’s small towns and rural areas and are incentivized to develop proposals that will attract those voters.This discussion may give the impression that there is no relationship between GDP and voting patterns in Wisconsin. As the next graph shows, that impression would be false. Both in Wisconsin and nationally, average GDP is higher in counties carried by Biden than those won by Trump.
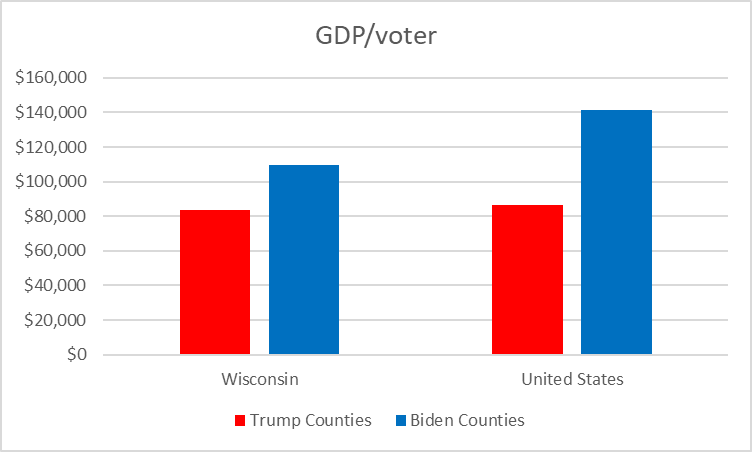
GDP/voter
The cause of this difference is unclear. Is it simply a reflection of urban/rural difference? If so, that raises the question of why so many rural voters are attracted to Trump. Or does it reflect a rigidity in Trumpism, manifested by the hostility towards masks and vaccines, that underlies a hostility to innovation and science? Recent years have seen numerous studies pointing out the limitations of using GDP as a measure of human welfare. All in all, however, one would rather see growing than shrinking GDP.
Data Wonk
-
Who Do You Trust to Conduct Elections Fairly?
 Apr 6th, 2026 by Bruce Thompson
-
Is Non-Citizen Voting a Real Threat to Elections in Wisconsin?
Mar 18th, 2026 by Bruce Thompson
-
How Global Climate Change Affects Milwaukee
 Mar 11th, 2026 by Bruce Thompson


I’ve noted the folks with their trump signs and “no more bs” flags still up… the rundown trailer house, the unkempt farm with delapidated outbuildings and manure-crusted cows, lawn signs next to the “jesus is lord” picket fence cross. There is no messiah that will save the eternally lost; the muddled masses.