How Gerrymandered Are We?
Simulating 100,000 elections shows Republicans gained the equivalent of 400,000 extra votes.
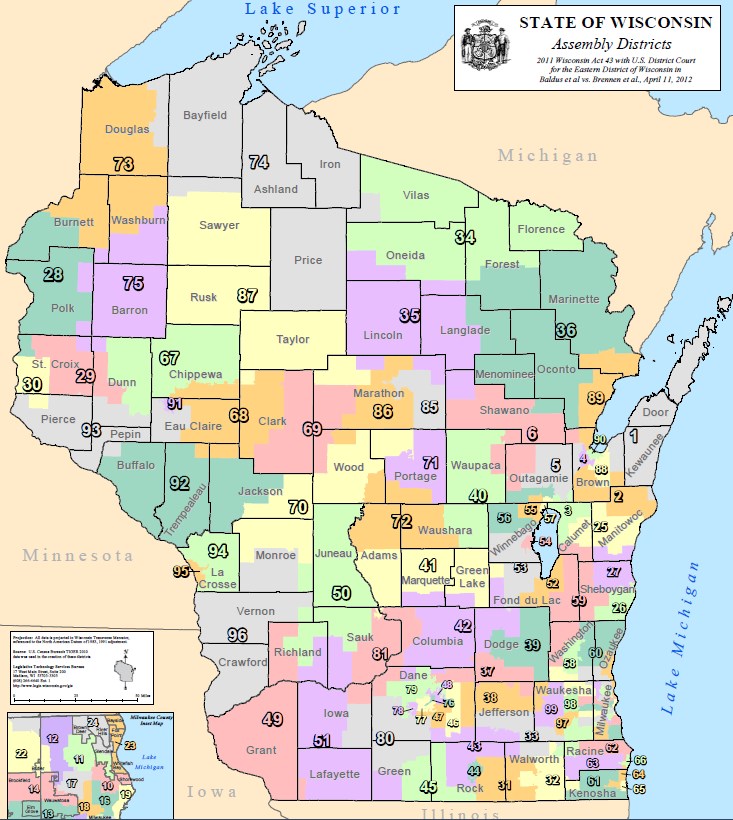
Assembly Districts
It has been well publicized that both Wisconsin’s state legislative and federal congressional districts were heavily gerrymandered in 2011 by Republicans in the Wisconsin state legislature as part of the nationwide “REDMAP” campaign. But it is not as well-known precisely to what extent they are gerrymandered.
Allow me to help fill that gap.
We can define disproportionality as the expected percentage of Democratic seats won, minus expected percentage of Democratic votes. And then you can multiply that percentage gap by the total number of districts to get how many extra seats they are getting, beyond what would be proportional to the statewide vote count. If the sign of disproportionality is positive, Democrats are getting extra seats, and if it’s negative, Republicans are getting extra seats.
With the intent of doing precisely this, I used AutoRedistrict (open source software that I developed which creates fair and compact electoral districts) to construct:
- a fair map,
- the most extreme gerrymander possible in favor of Democrats,
- the most extreme gerrymander possible in favor of Republicans, and
- the actual current map that was created from the 2010 census
Then I simulated 100,000 elections for each of these maps, and measured the disproportionality of each. This allows me to put the amount of disproportionality in the current map on a spectrum. (I’ve put the technical details of how I did this analysis at the end of this article, for those interested.)
Below is a chart of the results, including 50% confidence level bars. In other words, 25% of the simulated elections were below the confidence bar, 25% were above, and the blue dot in the middle is the mean outcome (total of all outcomes, divided by 100,000). The units are in congressional seats.
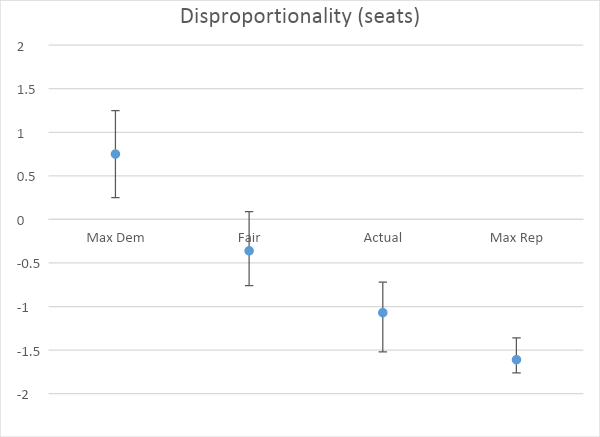
Disproportionality (seats)
A few interesting things to note:
- The results show that it is harder to gerrymander in favor of Democrats than in favor of Republicans. This makes sense when you consider that there is a high correlation between population density and the percent of Democratic voters. Democrats tend to pack themselves into cities, making it easier to disenfranchise them by making them vote in uncompetitive elections.
- AutoRedistrict didn’t make a perfectly fair map in terms of proportionality. This is because it optimizes a different (though related) metric – namely, “partisan symmetry.” Also it uses data from only one election to optimize, whereas this analysis used three. Furthermore, if a state has a slight lean in one direction, an even split of congressional seats – which would be the most fair – will still always have a slight bias left over, on average about a quarter of a seat.
Overall, by drawing the maps the way they did, Republicans were able to gain, on average, an extra seat in federal congress, making the Wisconsin congressional delegation 5-3 instead of 4-4. Wisconsin has 8 congressional districts, so this means that drawing the map this way is equivalent to giving themselves roughly an extra 1/8th of all votes cast. About 3.2 million votes were cast in Wisconsin, so 1/8th of this comes out to about 400,000 votes. Voting twice in an election is a felony. By this comparison, the gerrymandering that the Republicans in the Wisconsin Legislature did is equivalent to committing about 399,999 felonies. Put conversely, this is equivalent to disenfranchising 400,000 voters — all of them Democrat and no doubt many of them minorities.
Using computer algorithms, they could have pushed that to the limit and disenfranchised another 200,000 voters, gaining on average another half a seat, thus solidifying that 5-3 advantage and on rare occasion (about 5% of the time) even getting it up to the absolute maximum of 6-2. Their efforts managed to get them 2/3rds of the way to gerrymandering Wisconsin to the fullest extent possible, but not all of the way there. Nonetheless, the additional gerrymandering they could have done would not have been likely to net them another seat in any of the 5 elections before the next redistricting cycle.Bear in mind that as you get to higher amounts of disproportionality, it gets harder and harder to make the map more disproportional. For this reason, on a scale of 1 to 10, I’d give Wisconsin’s gerrymander roughly an eight. If they had used more sophisticated techniques they could have demonstrated a greater disregard for their constituents and the core concept of elections, but they certainly get an A for effort, and the practical impact is about the same as that of the most extreme gerrymander mathematically possible.
Data and Methodology
For this analysis, I used the Empirical Bayes method to construct maximum-likelihood fitted probability models of election returns for every district, using data from 3 elections. I used Beta distributions to model probability of voting one way or the other, Gamma distributions to model turnout, and then a Binomial distribution, parameterized by these Beta and Gamma distributions, to simulate election outcomes. I used an unbiased estimator for the Beta and Gamma distributions in order to reduce overfitting.
The source code for my analysis can be found at: https://github.com/happyjack27/autoredistrict/tree/master/src/new_metrics
I look forward to being able to use these same techniques to analyze proposed maps for the People’s Maps Commission of Wisconsin. I feel this is a valuable method of analyzing the partisan impact of proposed (or existing!) maps. This enables us to deliberately redistrict in a way that makes sure that everyone’s votes are impactful, and helps us get as close as we can to truly representative government.
Kevin Baas developed the AutoRedistrict software program, presented on the topic of gerrymandering at the Harvard 2019 CGA Conference, and has published two papers on the topic.
More about the Gerrymandering of Legislative Districts
- Without Gerrymander, Democrats Flip 14 Legislative Seats - Jack Kelly, Hallie Claflin and Matthew DeFour - Nov 8th, 2024
- Op Ed: Democrats Optimistic About New Voting Maps - Ruth Conniff - Feb 27th, 2024
- The State of Politics: Parties Seek New Candidates in New Districts - Steven Walters - Feb 26th, 2024
- Rep. Myers Issues Statement Regarding Fair Legislative Maps - State Rep. LaKeshia Myers - Feb 19th, 2024
- Statement on Legislative Maps Being Signed into Law - Wisconsin Assembly Speaker Robin Vos - Feb 19th, 2024
- Pocan Reacts to Newly Signed Wisconsin Legislative Maps - U.S. Rep. Mark Pocan - Feb 19th, 2024
- Evers Signs Legislative Maps Into Law, Ending Court Fight - Rich Kremer - Feb 19th, 2024
- Senator Hesselbein Statement: After More than a Decade of Political Gerrymanders, Fair Maps are Signed into Law in Wisconsin - State Senate Democratic Leader Dianne Hesselbein - Feb 19th, 2024
- Wisconsin Democrats on Enactment of New Legislative Maps - Democratic Party of Wisconsin - Feb 19th, 2024
- Governor Evers Signs New Legislative Maps to Replace Unconstitutional GOP Maps - A Better Wisconsin Together - Feb 19th, 2024
Read more about Gerrymandering of Legislative Districts here
Op-Ed
-
Wisconsin’s Utility Energy Crisis
 Mar 1st, 2026 by Isaiah Ness
-
Pete Buttigieg Comes to La Crosse
 Jan 20th, 2026 by Ruth Conniff
-
Trump Administration Has Abandoned Local Governments
 Dec 28th, 2025 by Sup. Jack Eckblad