
About That Data on Charter Schools
Diving deeper into charter school data and polls of voters tells interesting story.

School classroom. Image by Wokandapix on Pixabay
Last week, I wrote a column examining data on the performance of private schools in the Milwaukee Parental Program compared to public schools. I expected it to be controversial and was not disappointed. There were a number of comments, mostly critical ones.
I wish to thank all those who took the time and effort to write. This column is a follow-up on their comments.
The missing charter schools
The column looked at data (from the 2018-19 Wisconsin school report card) on public schools and on private schools in Wisconsin’s school choice programs. It limited its scope to high-poverty schools—those with at least 90% students of students judged to be “economically challenged.”
Ninety-one Wisconsin public schools meet that criterion, while 54 private schools accepting vouchers do. Ten of the 91 public schools are charter schools. While the analysis was not limited to Milwaukee schools, most of the schools are in Milwaukee.Every year (except for last year because of the pandemic), the Wisconsin Department of Public Instruction calculates a numerical “overall score” for each school, based on test scores, student growth, student engagement, and other factors. These scores are then translated into one of five “accountability ratings.”
The next graph shows the average overall score of each of the three groups of schools: public schools with charter schools removed, charter schools, and private schools accepting vouchers. Also shown are the cut points for the three middle overall accountability ratings.
On average, the ten charter schools have an overall rating of 73.7. Removing charter schools from the list of public schools causes the public school rating to drop from 62.0 to 60.6 for the remaining 81 public schools.
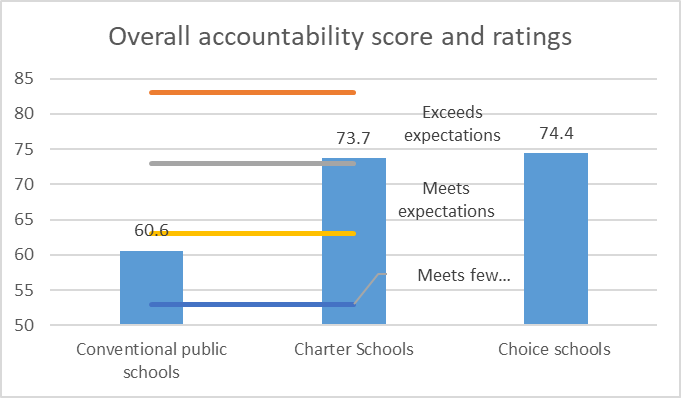
Overall accountability score and ratings
What is the distribution of performance among the three categories of schools? The next graph shows the percentage of each group of schools in each of the rating categories. The results are striking. Compared to conventional public schools, both charters and choice schools are skewed to the right. As ratings get higher, the percentage of conventional public schools gets smaller.
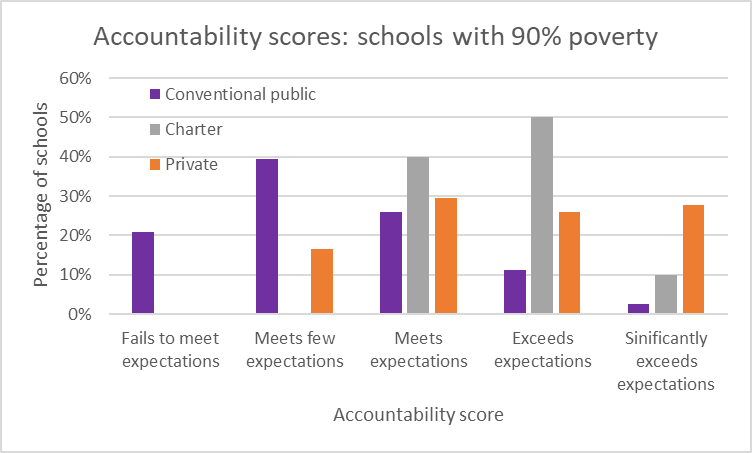
Accountability scores: schools with 90% poverty
What do the Marquette Poll results tell us?
The Marquette University Law School periodically polls Wisconsin voters for their opinions on public policy issues and public officials. Over the years the poll occasionally would ask a question about some issue related to school vouchers. Around 2013 there was a flurry of voucher questions apparently reflecting that the Legislature was considering statewide expansion of vouchers. Since then, voucher questions have become more sporadic. Two have been asked in the past two years:
- In April 2019, the poll asked, “Do you support or oppose a proposal to freeze the number of students who may enroll in private voucher schools across the state and to suspend the creation of new independent charter schools in the state?”
- In August 2020, voters were asked to agree or disagree with providing “tax-funded vouchers to be used for private or religious schools.”
In its reports the poll includes cross tabs that break out the results by some other information voters supply about themselves. One of these is geographic: whether the voter lived in the city of Milwaukee, elsewhere in the Milwaukee metro, the Madison area, the Fox Valley, or elsewhere in the state. The city of Milwaukee has the smallest population of the five.
The graph below summarizes the 95% confidence intervals of Milwaukee voters to the two questions. For example, in 2020, 65% of the sample of Milwaukee voters agreed with providing vouchers to low-income students. If every Milwaukee voter were asked the question, there is a 95% probability that the average supporting vouchers would fall between 46% and 83%.
Likewise, 62% of the previous years’ sample opposed the freeze, with a 95% confidence interval between 49% and 74%. Note that in both cases the lower bound is slightly less than 50%, suggesting that the possibility that a majority of Milwaukee voters oppose vouchers should not be ruled out.
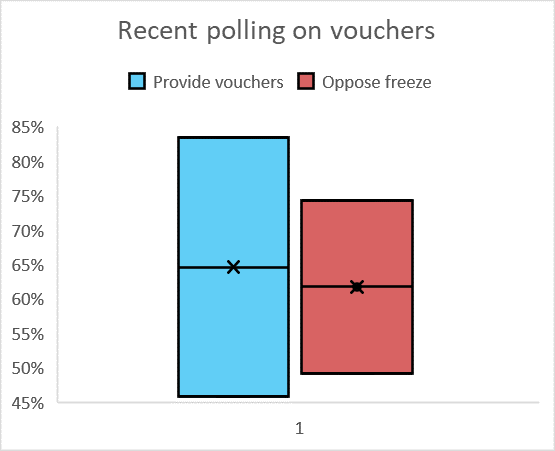
Recent polling on vouchers
One possible solution to the problem of small sample size is to find ways to increase the size by bringing in other similar questions. As mentioned, there was a flurry of voucher questions around 2013 but little since and nothing before. Thus I collected all the voucher questions and added up the number of responses favoring vouchers and those opposed.
One issue is illustrated by the graph below. It offered voters four options, rather than two. Clearly to expand statewide is supportive to vouchers and ending vouchers is opposed—but what about the two options in the middle: no expansion or allowing expansion only in large cities. Ultimately, I counted those limiting expansion to large cities as voucher supporters and those against expansion as voucher opponents. (Jill Underly, who just won the race for state school superintendent, opposed expansion of Wisconsin choice programs, but didn’t push to close them down.)
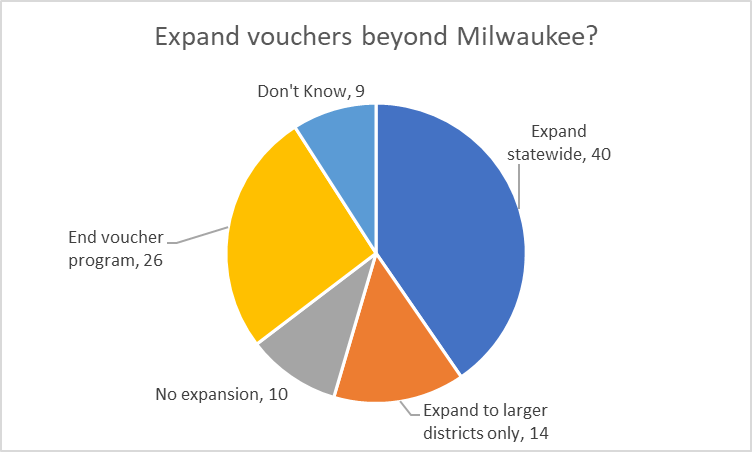
Expand vouchers beyond Milwaukee?
The next chart shows the result. Of the 1004 Wisconsin voters answering a voucher-related question, 437 (43%) opposed them while 567 (57%) supported them. The 95% margin of error was 2%.

Overall voucher support in Milwaukee
This is almost a flip of Madison where opponents of vouchers led supporters by 58% to 42%. Milwaukee and Madison are Wisconsin’s two most Democratic cities. Candidates that win one generally win the other. The difference can be attributed to Milwaukee’s greater pragmatism. For a significant portion of its population, vouchers and charter schools are regarded as crucial for Milwaukee’s children.
Data Wonk
-
Who Do You Trust to Conduct Elections Fairly?
 Apr 6th, 2026 by Bruce Thompson
-
Is Non-Citizen Voting a Real Threat to Elections in Wisconsin?
Mar 18th, 2026 by Bruce Thompson
-
How Global Climate Change Affects Milwaukee
 Mar 11th, 2026 by Bruce Thompson


Since parents have to apply to both choice and charter schools, the amount of engagements should be greater than public schools. Choice and charter schools are a public policy absurdity it that the legislative gives most any entity the right to start school with government funding with little oversight and, in the case of choice schools, they do discriminate against LBGQ students, their families or staff members who support them.