
Will Biden Relief Plan Work?
Its likely impact will be very different than that of the Trump tax cuts.

Joe Biden and Donald Trump.
Wisconsin Senator Ron Johnson was recently quoted as criticizing the COVID-19 relief package, called the American Rescue Plan Act or ARPA.
This is not Covid relief – it is a massive debt burden that further mortgages our children’s future. … It was unneeded and unwise.
In one sense he is right: the ARPA’s $1.9 trillion cost is very large. But does it reach the level needed to attack the challenge?
The law is aimed at two goals. One is to help people and their businesses survive the coronavirus. The second is to assure a quick recovery once most of the population was vaccinated.
There is a growing consensus that while the Obama administration’s actions ten years ago helped prevent the Great Recession from turning into another Great Depression, they were too modest to prevent long-term damage to the economy.As evidence, consider the next chart. The blue line shows the actual number of American jobs from January of 1939 to February of this year. The data come from the U.S. Bureau of Labor Statistics and were downloaded from the Federal Reserve Bank of St. Louis’ FRED database.
I compared this to the number of projected jobs (shown with the red line) that might have been expected based on past history. To create the projection I used all the data between 1939 and the start of 2008 when the Great Recession was just getting underway. The fit to the pre-2008 data is very good, evidenced by an adjusted R-square of .993. This means the model explains 99.3% of the variation in the pre-2008 data.
However, starting in 2008, while the economy resumed growing, it did so at a much lower level. In January 2020, before the virus struck, the model predicts over 20 million more American jobs than actually existed.

Non-farm jobs since 1939
The next chart shows the growth of real gross domestic product (GDP) as calculated by the U.S. Bureau of Economic Analysis and retrieved from FRED. As with jobs, I developed the projected line by using regression. As before, the projected line fits the pre-2008 data very well, with an adjusted R-square of .995, meaning the model explains 99.5% of the variation.
Again, there is an unrecovered dip starting in 2008. By the end of 2019, before the coronavirus struck the model overestimates the GDP by $1.5 trillion — a huge loss for the economy.
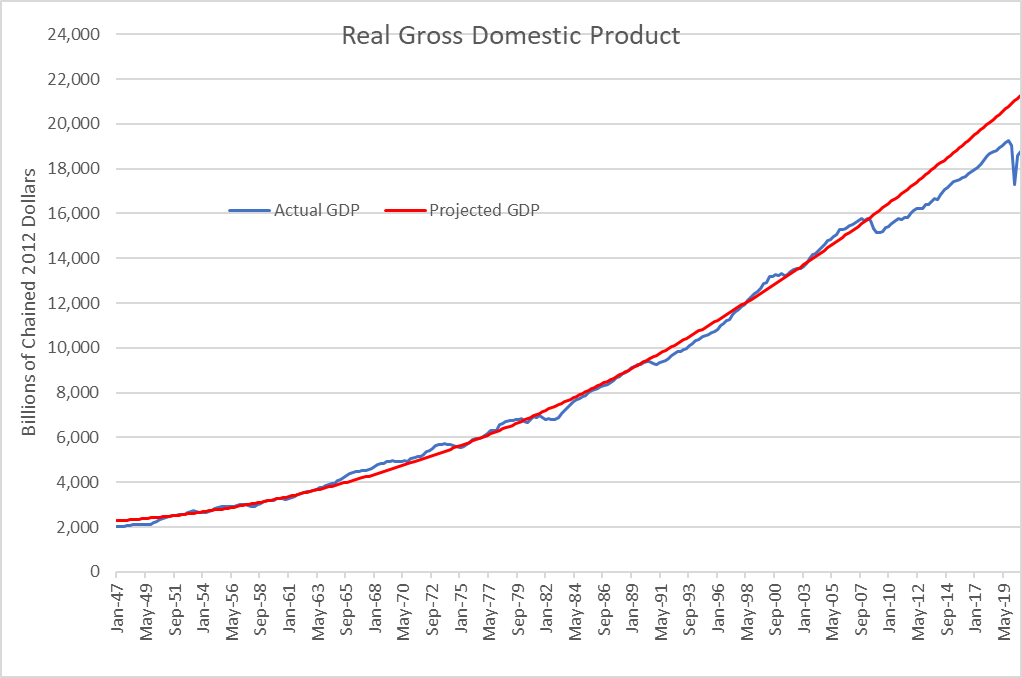
Real Gross Domestic Product
Earlier this month, the Organization for Economic Cooperation and Development (OECD) issued its Economic Outlook Interim Report on the global economy. Compared to its earlier report, issued in December, the OECD doubled its growth forecast for the US economy in 2021, from 3.2% to 6.5%. The report said the $1.9 trillion stimulus package “will provide a significant near-term boost to activity.”
The significant fiscal stimulus in the United States, along with faster vaccination, could boost US GDP growth by over 3 percentage points this year, with welcome demand spillovers in key trading partners.
The following chart shows the December growth estimates the OECD published in green. The increase in the growth estimate is shown in orange. The numbers show the total March estimate for growth in 2021. For example, the OECD global growth estimate for 2021 in the December report was 4.2%. In March the world estimate was 5.6%, an increase of 1.4%.
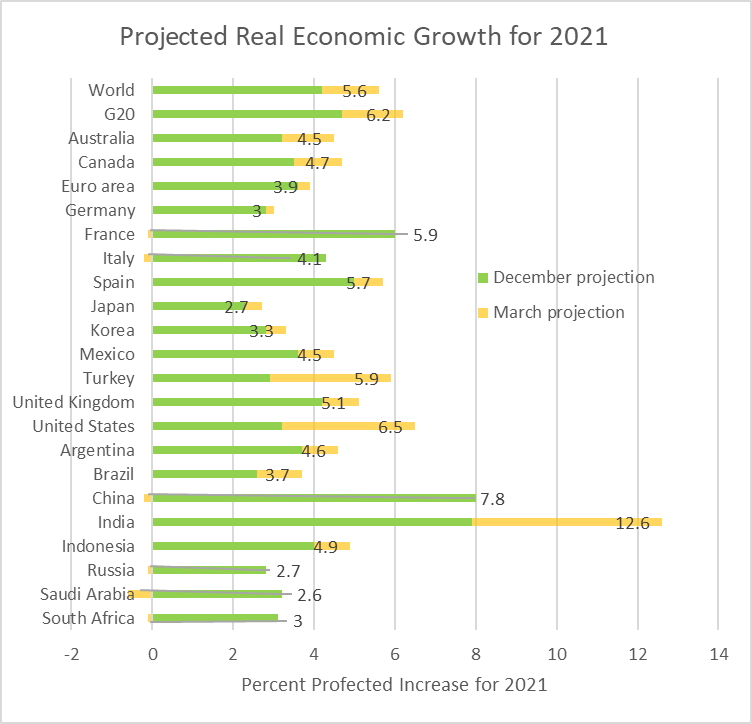
Projected Real Economic Growth for 2021
For years, Republicans’ proposals to strengthen the economy emphasized cutting taxes on wealthy people. Legislation enacted in 2017, called the Tax Cuts and Jobs Act, illustrates that propensity well.
This strategy has two main faults. First, it gives money to rich people who did not need more, increasing financial inequality and doing little to help poor people. Second, it is an inefficient way to stimulate the economy: rich people are more likely to save additional funds; poor people are likely to spend it for food, rent, or numerous other needs. Thus, their multiplier effect is greater.
In choosing who will get the funds, the 2021 American Rescue Plan Act takes a tack opposite to that of the Tax Cuts Act: more of the benefits flow to poor people; less to the wealthy.The next four charts show the results of the Tax Policy Center’s analyses of the distribution effects of the 2017 Tax Cuts Act passed during the Trump administration, as compared to the 2021 American Rescue Plan.
The first of these graphs compares the projected change in income under the two acts for five income groups. For example, the lowest income group received a half of one percentage increase in income from the Tax Cuts Act (shown in red). That same group receives an income boost of 20% from the Rescue Plan. As income rises, so does the percentage increase from the Tax Cuts act. With the Rescue Plan (in blue), as income rises, the percentage increase falls.
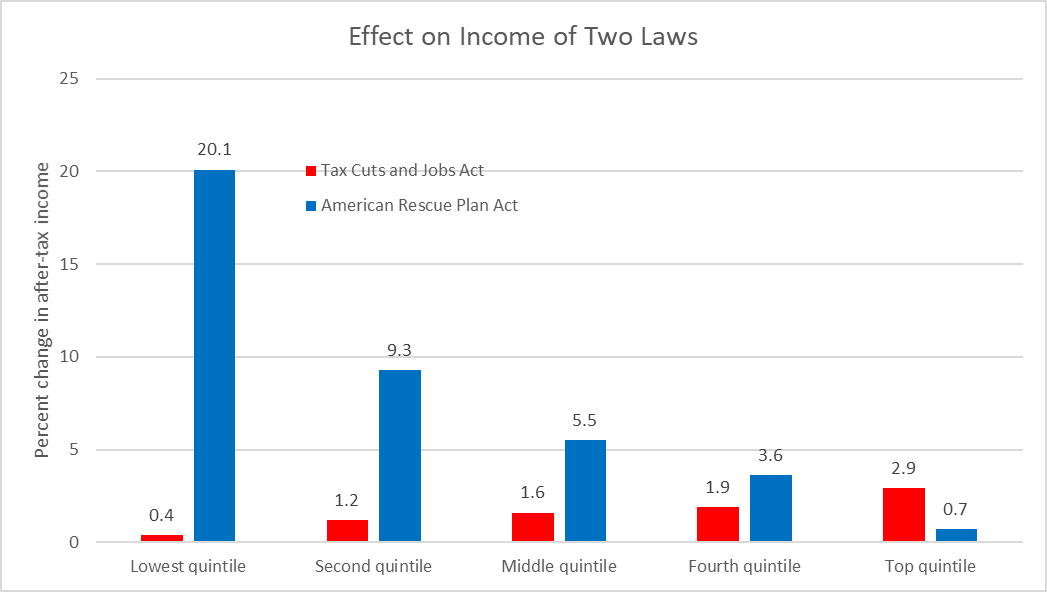
Effect on Income of Two Laws
The next graph shows the percentage income change in the top 20% of the population.
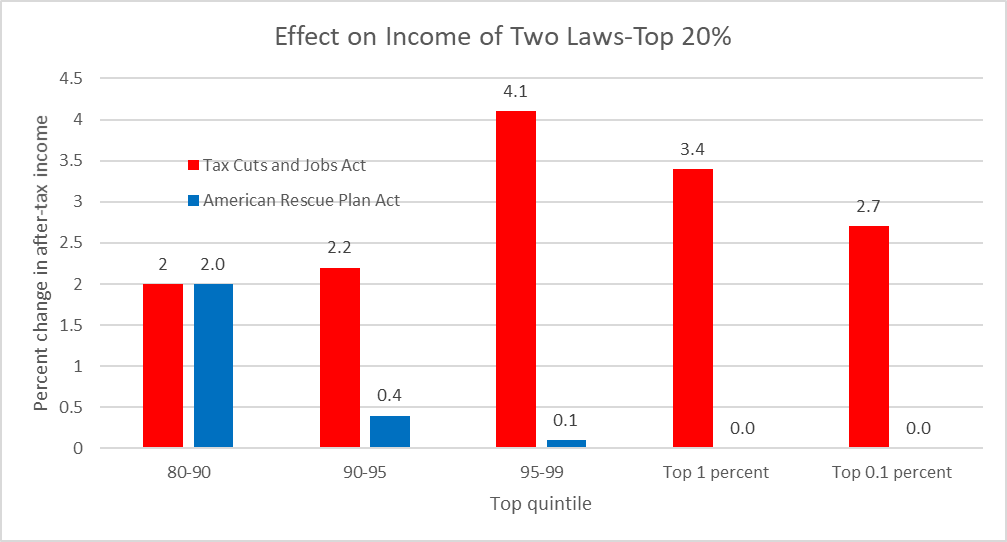
Effect on Income of Two Laws-Top 20%
The next two charts show the dollar amounts of the average tax decreases under the two laws.
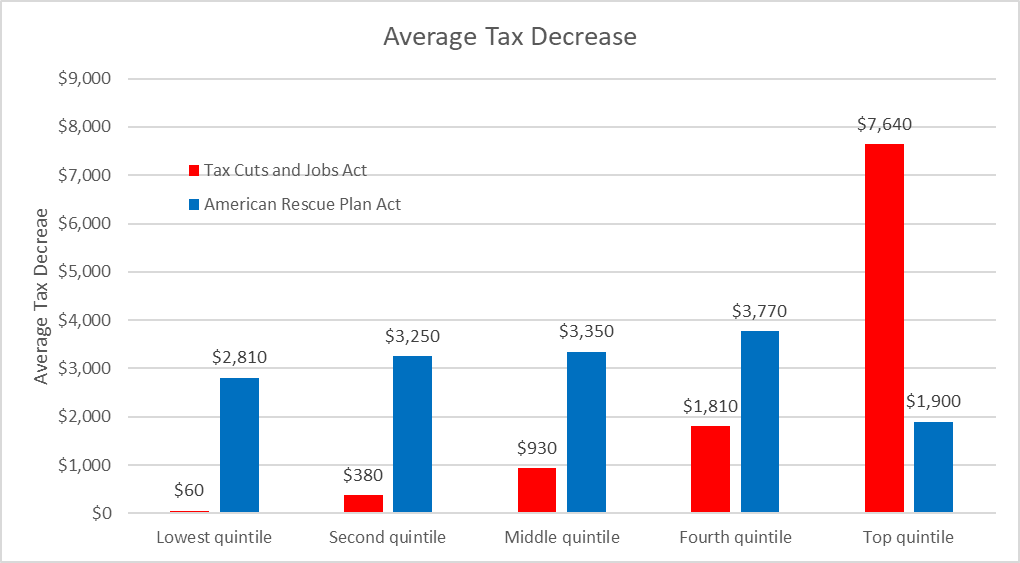
Average Tax Decrease
Finally, here are the dollar tax decreases for the top 20%. For the top 0.1% of the population, the difference between the two laws is stark: a saving of almost $200,000 under the Tax Cuts Act versus a nominal $20 increase under the Rescue Plan.
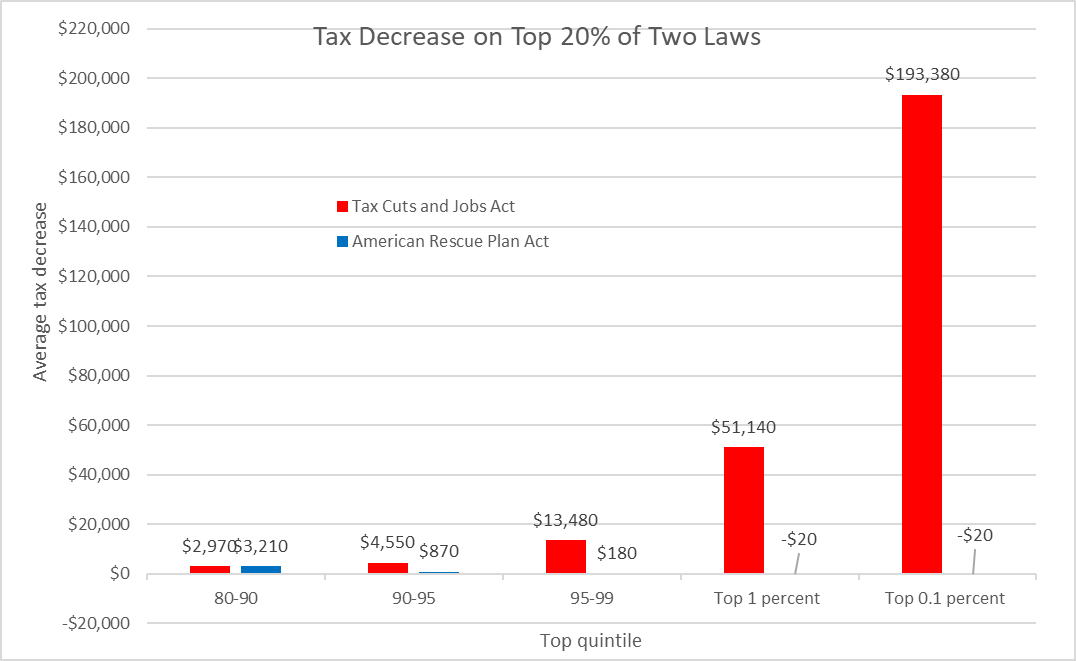
Tax Decrease on Top 20% of Two Laws
Doubtless there will be sections of the American Rescue Plan Act that will prove irrelevant or even harmful as the nation tries to recover from COVID-19 and its recession. However, the enthusiasm about the plan by those whose job is to project economic futures is heartening, as is the plan’s rejection of trickle-down economics. And if those projections are correct, it may be big enough to live up it its title and rescue America’s economy.
Data Wonk
-
Who Do You Trust to Conduct Elections Fairly?
 Apr 6th, 2026 by Bruce Thompson
-
Is Non-Citizen Voting a Real Threat to Elections in Wisconsin?
Mar 18th, 2026 by Bruce Thompson
-
How Global Climate Change Affects Milwaukee
 Mar 11th, 2026 by Bruce Thompson


As usual, Bruce Thompson bases his analysis and conclusions on real data. How unlike the approach taken by those who favor trickle-down giveaways to the ultra-wealthy, or who claim that tax cuts for the wealthy will supercharge the economy and pay for themselves — they never do.