How Trump Lost Wisconsin
County-by-county analysis shows similar pattern of voting to 2016 — with key differences.

Donald Trump. Photo from whitehouse.gov.
One of the strongest predictors of the vote in the state’s 72 counties in November was how they voted in 2016, when Donald Trump lost the popular vote to Hillary Clinton but won the electoral college decisively. As evidence, consider the next chart, which compares the votes by county for the Democratic candidate in the two elections, and shows the same pattern of voting.
The horizontal scale shows the number of Wisconsin votes for Clinton in 2016. The dots represent each county in Wisconsin. The vertical scale shows the number of votes by county for Joe Biden in 2020. (To fit counties as large as Milwaukee and as small as Menominee onto the same chart, I used logarithmic scales for both years. This had the effect of shrinking large numbers and stretching small numbers. Each vertical and horizontal line is ten times its previous line.)
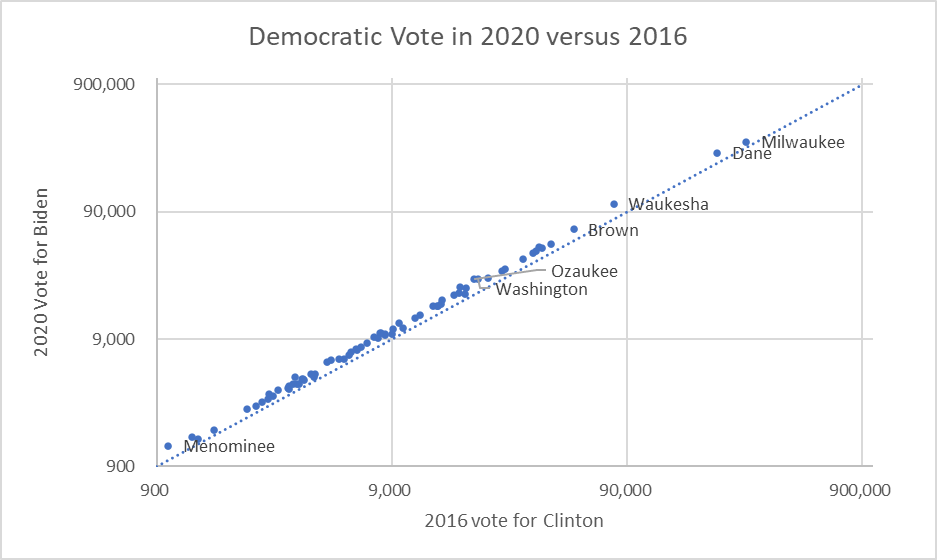
Democratic Vote in 202 versus 2016
The dotted line on the graph is the diagonal. If a county were to have cast the same number of votes for Biden as for Clinton, its dot would fall on that line. Instead, all the dots are above the diagonal, indicating that Biden received more votes than Clinton in every Wisconsin county.
The next chart compares the Trump vote in 2020 (vertical scale) to that in 2016 (horizontal). As with Biden and Clinton, Trump 2020 managed to get more votes than Trump 2016 in every Wisconsin county.
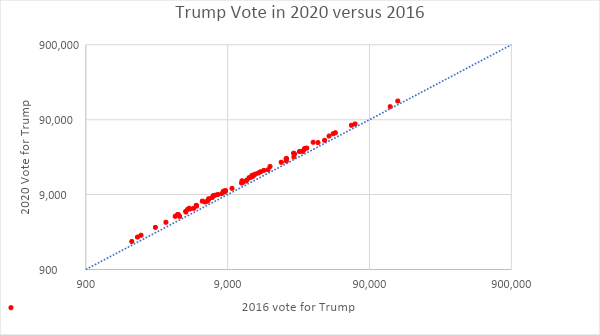
Trump Vote in 2020 versus 2016
In fact, both major party candidates managed to get substantially more votes throughout Wisconsin in 2020 than they (or their party colleague) got four years ago. As the next chart shows, however, Biden’s vote increase was 40,000 more than Trump’s. Thus did Biden flip Wisconsin from Republican to Democratic.
Where did the increased votes for both major candidates come from? Roughly 320,000 more people voted in 2020 than in 2016, as shown by the furthest right column on the graph below. And another 130,000 who voted for a third party in 2016 switched to either the Republican or Democratic candidates. Together the major party candidates received about 450,000 more votes.

Vote change 2016 to 2020
2020 was not a good year for candidates running outside the two major party system. These saw their total vote drop from 188,000 in 2016 to 57,000 in 2020. The circular chart below shows the most notable members of this group. Of these, Don Blankenship was the only one listed on the ballot under the name of a party. Jorgensen and Brian Carroll were listed as “Independents,” but Jo Jorgensen seems to have run as the candidate of the Libertarian Party. Howie Hawkins and Kanye West failed to get on the ballot and received only write-in votes.
In 2016, many Democrats accused the Green Party of being “spoilers,” for taking enough votes away from Clinton to allow Trump to win Wisconsin. This charge seems dubious; for that to work, one has to assume that almost every Green Party vote would have otherwise swung to Clinton. Or that most votes for the Libertarian candidate (a much larger number) would have gone to Clinton.
On a tied vote, the Wisconsin Elections Commission decided not to put Hawkins, this year’s Green candidate, on the ballot. The fact that all three Democratic members voted against the Greens left the impression that the decision was driven by partisan considerations.
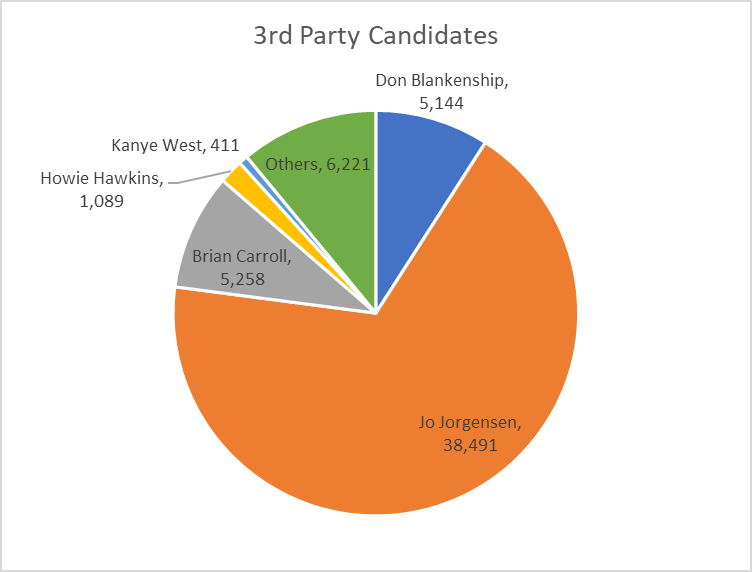
3rd Party Candidates
Although votes for both candidates increased across the board in Wisconsin, the amount of increase varied from county to county. The next chart shows the percentage of increase in the Democratic vote between 2016 and 2020, compared to the total Clinton vote in 2016.
As with the previous graphs, I have labeled several of the counties, including the so-called “WOW” counties (Waukesha, Ozaukee, and Washington), part of the Milwaukee metropolitan area. Over the past four years, the Democratic vote in all three increased by more than 25 percent. Still, one should be careful not to over-interpret these numbers. For one, even if this rate of change were to continue it would take several presidential election cycles for these counties to become competitive.Also, the percentage change is larger partly because the starting point is smaller. Dane County’s 20% increase in Democratic votes in 2020 brings a lot more Biden votes than does Ozaukee’s 30% increase. Finally, note that Milwaukee County, while supplying lots of Democratic votes, is among the lowest in its percentage increase.

Dem % change 2016 to 2020
The next chart is the reverse of the previous chart; it compares the growth in Trump votes to his 2016 vote. To some extent, the story it tells is the reverse of the Democratic chart, showing the weakness of Trump’s vote growth in Ozaukee and Waukesha counties.
Milwaukee County is the big exception to this rule. Although growth in its Democratic vote is near the bottom among Wisconsin counties, growth in the Trump vote is the lowest of any of the counties.
If a trend line were placed on the graph below it would slope downward, meaning that as population increases, a county is likely to be less supportive of Donald Trump. This is consistent with others’ observation. The question is why people living in small towns and rural areas would find him more appealing than those living in larger cities.
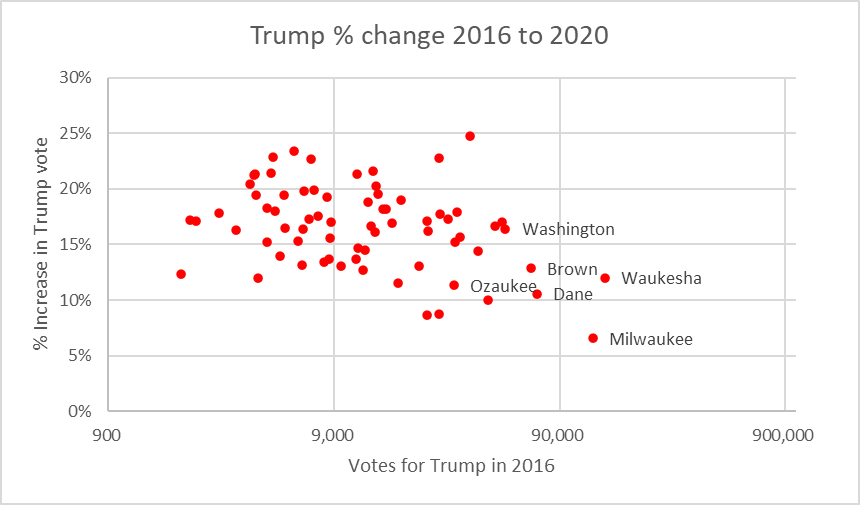
Trump % change 2016 to 2020
Events surrounding the election remove any doubt that Trump, left to his own devices, would end American democracy. The remaining puzzle is why so many Americans—and so many Wisconsinites—would aid him in this project.
More about the 2020 General Election
- FBI Knocks, Milwaukee Answers With Two New Law Firms On Its Side - Jeramey Jannene - Jun 2nd, 2026
- FBI Wants to Interview Milwaukee Police Officers Related to 2020 Election - Jeramey Jannene - May 21st, 2026
- MKE County: FBI Visits Milwaukee County Elections Director - Graham Kilmer - May 14th, 2026
- Senator Agard Statement on Senator Knodl’s Continued Relitigation of the 2020 Presidential Election - Dane County Executive Melissa Agard - Aug 29th, 2023
- Report Calls For Criminally Charging State’s Fake Electors - Henry Redman - Dec 19th, 2022
- Vos Withdraws Subpoenas, Ends Gableman Probe - Henry Redman - Aug 30th, 2022
- Judge Blasts Gableman Probe, Deleted Records - Henry Redman - Aug 17th, 2022
- Vos Fires Gableman, Ends Election Probe - Shawn Johnson - Aug 14th, 2022
- Judge Orders Gableman To Pay $163,000 In Legal Fees - Rich Kremer - Aug 2nd, 2022
- Prosecute 2020 Fake Electors, Advocates Demand - Erik Gunn - Aug 1st, 2022
Read more about 2020 General Election here
Data Wonk
-
Who Do You Trust to Conduct Elections Fairly?
 Apr 6th, 2026 by Bruce Thompson
-
Is Non-Citizen Voting a Real Threat to Elections in Wisconsin?
Mar 18th, 2026 by Bruce Thompson
-
How Global Climate Change Affects Milwaukee
 Mar 11th, 2026 by Bruce Thompson