100-Day High In New COVID-19 Hospitalizations
But the number of people actively hospitalized remains elusive.
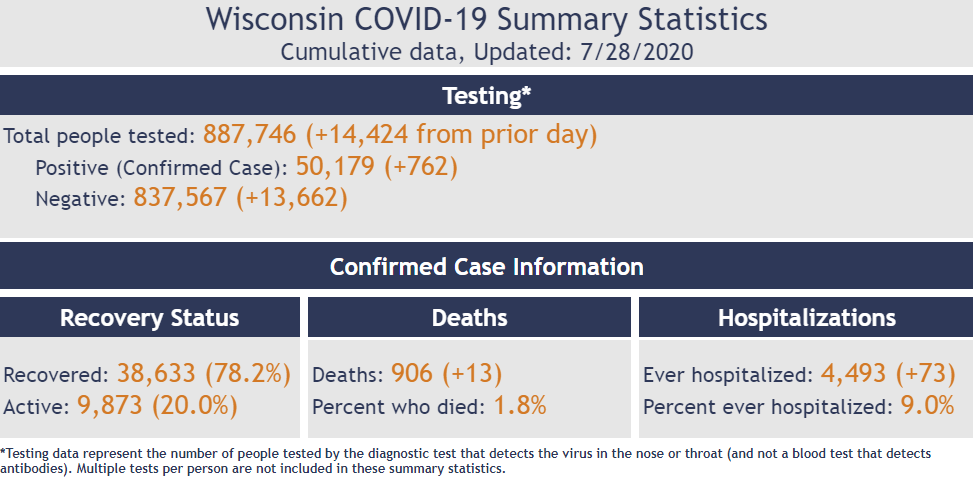
The Wisconsin Department of Health Services reported 73 people were newly hospitalized with a confirmed case of COVID-19 in the past 24 hours. That’s the highest total reported in 112 days and above the 30-day average of 37.
But the total number of people actively hospitalized remains elusive for the seventh day. A message on the Wisconsin Hospital Association dashboard said the organization is making changes to accommodate “recently announced requirements from the U.S. Department of Health and Human Services. We are working to make any disruption as short and minimal as possible.”
A total of 4,493 Wisconsin residents have been hospitalized with the disease since the outbreak began, 8.95 percent of all people with a confirmed case of the disease.
Thirteen COVID-19 deaths were reported in the past 24 hours, bringing the statewide total to 906. An average of 4.3 deaths per day have been reported over the past 30 days, below the 100-day average of 6.86.
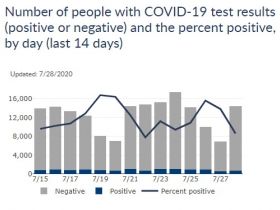
DHS reported 762 new cases from 14,424 processed tests, a positive case rate of 5.28 percent. The seven- and 14-day positive case rates averages now stand at 6.50 and 6.95 percent, figures that have fallen from highs of 7.45 and 7.19 percent in the past weeks. Both are still up from June 19th when the 14-day average hit a pandemic low of 2.69 percent.
Health officials have looked for the percentages to trend downward as testing expands as an indicator of a slowing spread of the disease, but for the past month testing has expanded alongside the percentage, indicating an accelerating spread.
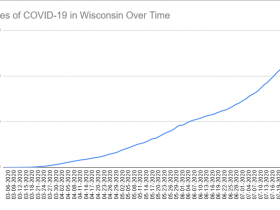
A total of 50,179 people have tested positive for the disease since the outbreak began, with 6,044 in the past week and 12,273 in the past 14 days. DHS reports that 79 percent of individuals with a confirmed case have “recovered,” as defined by a documented abatement of symptoms or a diagnosis over 30 days ago.
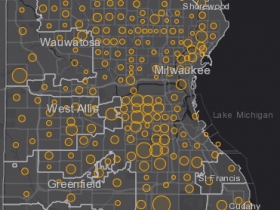
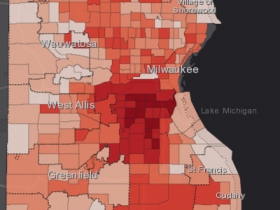
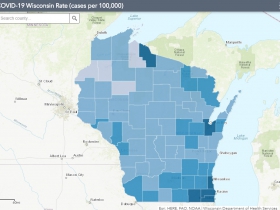
According to DHS data, 1,941.7 out of every 100,000 Milwaukee County residents have tested positive for COVID-19 (up from 1,918) since the outbreak began. Racine County has 1,527.1 cases per 100,000 residents (up from 1,510.3). Brown County, which is anchored by Green Bay, has 1,471.2 cases per 100,000 residents (up from 1,450.4).
Kenosha (1,369.3), Iron (1,172.4), Walworth (1,051.3), Trempealeau (941), Rock (806.7), Waukesha (795.7), Dane (736.8) and Dodge (714.3) are the only other counties with more than 700 cases per 100,000 residents.
The statewide average of cases per 100,000 residents rose to 868.4 (up from 855.2 yesterday).
Charts and Maps
Percent of COVID-19 cases by hospitalization status
| Hospitalization status | Number of confirmed cases as of 7/28/2020 | Percent of confirmed cases as of 7/28/2020 |
|---|---|---|
| Ever hospitalized | 4,493 | 9% |
| Never hospitalized | 28,609 | 57% |
| Unknown | 17,077 | 34% |
| Total | 50,179 | 100% |
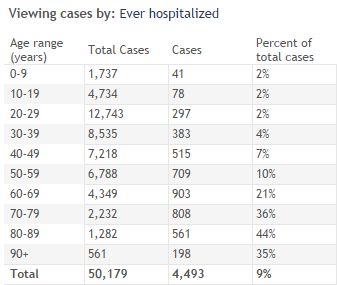
Percent of COVID-19 cases resulting in hospitalization within age group
Confirmed COVID-19 cases and deaths by gender
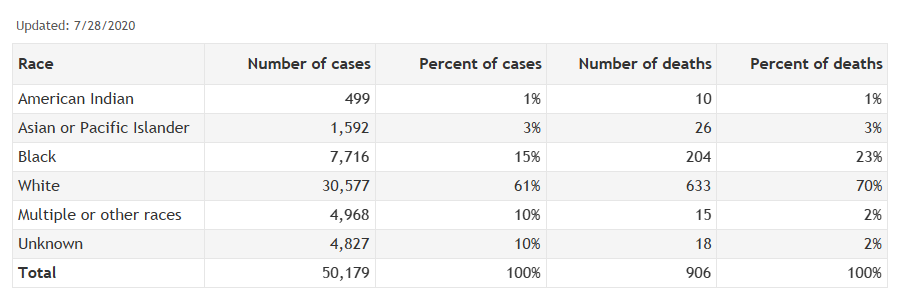
Confirmed COVID-19 cases and deaths by race
Confirmed COVID-19 cases and deaths by ethnicity
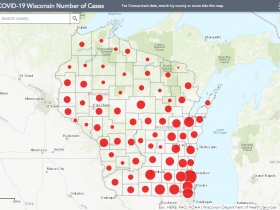
Number of positive cases and deaths by county
| Wisconsin County | Positive as of 7/28/2020 | Negative as of 7/28/2020 | Deaths as of 7/28/2020 | Rate (positive cases per 100,000 people) as of 7/28/2020 | Case fatality percentage (percent of cases who died) as of 7/28/2020 |
|---|---|---|---|---|---|
| Adams | 64 | 2,237 | 2 | 318.8 | 3% |
| Ashland | 15 | 1,568 | 0 | 95.5 | 0% |
| Barron | 133 | 5,051 | 3 | 293.9 | 2% |
| Bayfield | 19 | 1,740 | 1 | 126.7 | 5% |
| Brown | 3,822 | 42,017 | 50 | 1471.2 | 1% |
| Buffalo | 37 | 1,533 | 2 | 281.0 | 5% |
| Burnett | 13 | 1,378 | 1 | 85.2 | 8% |
| Calumet | 221 | 5,199 | 2 | 443.7 | 1% |
| Chippewa | 198 | 9,457 | 0 | 311.1 | 0% |
| Clark | 161 | 3,323 | 7 | 466.8 | 4% |
| Columbia | 198 | 8,626 | 1 | 347.6 | 1% |
| Crawford | 53 | 3,096 | 0 | 325.4 | 0% |
| Dane | 3,904 | 110,666 | 35 | 736.8 | 1% |
| Dodge | 627 | 14,493 | 5 | 714.3 | 1% |
| Door | 81 | 3,938 | 3 | 295.2 | 4% |
| Douglas | 96 | 4,058 | 0 | 221.2 | 0% |
| Dunn | 95 | 5,040 | 0 | 213.5 | 0% |
| Eau Claire | 441 | 13,070 | 3 | 428.2 | 1% |
| Florence | 5 | 537 | 0 | 115.3 | 0% |
| Fond du Lac | 503 | 13,405 | 7 | 491.6 | 1% |
| Forest | 57 | 859 | 4 | 632.1 | 7% |
| Grant | 299 | 8,235 | 14 | 576.9 | 5% |
| Green | 121 | 4,312 | 1 | 328.2 | 1% |
| Green Lake | 49 | 2,236 | 0 | 261.2 | 0% |
| Iowa | 58 | 3,594 | 0 | 245.6 | 0% |
| Iron | 67 | 909 | 1 | 1172.4 | 1% |
| Jackson | 43 | 4,850 | 1 | 209.7 | 2% |
| Jefferson | 525 | 11,655 | 4 | 620.2 | 1% |
| Juneau | 112 | 5,584 | 1 | 423.9 | 1% |
| Kenosha | 2,305 | 25,060 | 51 | 1369.3 | 2% |
| Kewaunee | 105 | 2,262 | 2 | 515.7 | 2% |
| La Crosse | 759 | 16,097 | 1 | 644.0 | 0% |
| Lafayette | 101 | 2,063 | 0 | 603.5 | 0% |
| Langlade | 35 | 1,897 | 1 | 182.6 | 3% |
| Lincoln | 56 | 2,926 | 0 | 201.1 | 0% |
| Manitowoc | 257 | 9,357 | 1 | 323.6 | 0% |
| Marathon | 512 | 11,026 | 4 | 378.5 | 1% |
| Marinette | 255 | 6,293 | 3 | 629.1 | 1% |
| Marquette | 66 | 1,684 | 1 | 434.0 | 2% |
| Menominee | 18 | 1,573 | 0 | 393.1 | 0% |
| Milwaukee | 18,528 | 161,361 | 428 | 1941.7 | 2% |
| Monroe | 184 | 6,458 | 1 | 404.4 | 1% |
| Oconto | 149 | 5,382 | 0 | 396.7 | 0% |
| Oneida | 70 | 4,019 | 0 | 198.0 | 0% |
| Outagamie | 991 | 22,820 | 12 | 536.4 | 1% |
| Ozaukee | 482 | 9,465 | 16 | 546.0 | 3% |
| Pepin | 41 | 906 | 0 | 564.6 | 0% |
| Pierce | 152 | 4,183 | 0 | 365.4 | 0% |
| Polk | 103 | 5,270 | 2 | 237.6 | 2% |
| Portage | 323 | 7,999 | 0 | 457.5 | 0% |
| Price | 19 | 1,678 | 0 | 140.8 | 0% |
| Racine | 2,984 | 39,436 | 73 | 1527.1 | 2% |
| Richland | 21 | 2,473 | 4 | 119.7 | 19% |
| Rock | 1,305 | 22,339 | 25 | 806.7 | 2% |
| Rusk | 13 | 1,161 | 1 | 91.7 | 8% |
| Sauk | 309 | 11,365 | 3 | 485.9 | 1% |
| Sawyer | 26 | 2,370 | 0 | 158.8 | 0% |
| Shawano | 138 | 5,620 | 0 | 336.5 | 0% |
| Sheboygan | 505 | 14,083 | 5 | 438.3 | 1% |
| St. Croix | 400 | 9,542 | 2 | 455.0 | 1% |
| Taylor | 41 | 1,605 | 0 | 201.4 | 0% |
| Trempealeau | 277 | 4,512 | 1 | 941.0 | 0% |
| Vernon | 51 | 3,497 | 0 | 167.1 | 0% |
| Vilas | 24 | 1,952 | 0 | 111.1 | 0% |
| Walworth | 1,083 | 13,428 | 21 | 1051.3 | 2% |
| Washburn | 13 | 1,639 | 0 | 82.9 | 0% |
| Washington | 724 | 12,354 | 21 | 538.1 | 3% |
| Waukesha | 3,174 | 43,894 | 48 | 795.7 | 2% |
| Waupaca | 331 | 7,019 | 14 | 643.4 | 4% |
| Waushara | 86 | 4,884 | 0 | 356.6 | 0% |
| Winnebago | 970 | 23,802 | 16 | 570.8 | 2% |
| Wood | 176 | 8,147 | 1 | 240.2 | 1% |
| Total | 50,179 | 837,567 | 906 | 868.4 | 2% |
If you think stories like this are important, become a member of Urban Milwaukee and help support real, independent journalism. Plus you get some cool added benefits.
More about the Coronavirus Pandemic
- Governors Tony Evers, JB Pritzker, Tim Walz, and Gretchen Whitmer Issue a Joint Statement Concerning Reports that Donald Trump Gave Russian Dictator Putin American COVID-19 Supplies - Gov. Tony Evers - Oct 11th, 2024
- MHD Release: Milwaukee Health Department Launches COVID-19 Wastewater Testing Dashboard - City of Milwaukee Health Department - Jan 23rd, 2024
- Milwaukee County Announces New Policies Related to COVID-19 Pandemic - David Crowley - May 9th, 2023
- DHS Details End of Emergency COVID-19 Response - Wisconsin Department of Health Services - Apr 26th, 2023
- Milwaukee Health Department Announces Upcoming Changes to COVID-19 Services - City of Milwaukee Health Department - Mar 17th, 2023
- Fitzgerald Applauds Passage of COVID-19 Origin Act - U.S. Rep. Scott Fitzgerald - Mar 10th, 2023
- DHS Expands Free COVID-19 Testing Program - Wisconsin Department of Health Services - Feb 10th, 2023
- MKE County: COVID-19 Hospitalizations Rising - Graham Kilmer - Jan 16th, 2023
- Not Enough Getting Bivalent Booster Shots, State Health Officials Warn - Gaby Vinick - Dec 26th, 2022
- Nearly All Wisconsinites Age 6 Months and Older Now Eligible for Updated COVID-19 Vaccine - Wisconsin Department of Health Services - Dec 15th, 2022
Read more about Coronavirus Pandemic here





>>> TA message on the Wisconsin Hospital Association dashboard said the organization is making changes to accommodate “recently announced requirements from the U.S. Department of Health and Human Services. We are working to make any disruption as short and minimal as possible.” <<<
Why didn’t they just keep reporting it where it was going to until they made the new one work also? Why don’t they just keep doing both into the future? I’m sure 45s admin. made that an unattractive proposition, and now we all suffer with gaps in the most crucial data. Reagan started this mess of “gov’t being the problem” and now the dumbasses who believed that are the ones in power. We’re all f’ed!