Will State Face a Second COVID-19 Wave?
All evidence suggests state is doing well. But there may be danger from other states.
2019 Novel Coronavirus. Image by the Centers for Disease Control and Prevention.
There is increasing talk of a second COVID-19 wave coming this fall. However, if one strips out data from places like New York City the first wave is still ongoing for much of the country. In this column, I look at the disease data for Wisconsin, which overall is optimistic, and then turn to worrying activity at the national level.
The chart shows the number of reported new cases of COVID-19 in Wisconsin reported each day since early March (in blue). The daily reported cases rose at a fairly steady rate until late May, when they began a decline. (This chart uses data compiled by the New York Times.)
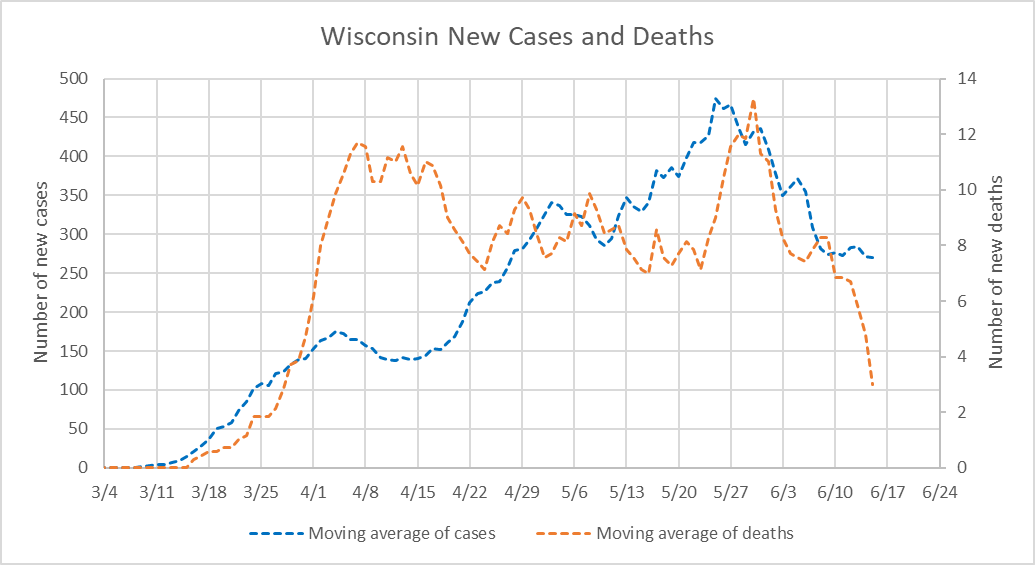
Wisconsin New Cases and Deaths
Deaths for COVID-19 (shown in orange) have peaked twice. Starting in early June, deaths, like new cases have declined.
To further explore where the cases are coming from, the next chart shows the number of cases for Milwaukee County (shown in green) versus the remainder of Wisconsin. The total for the state is shown in black. It appears that the recent decline in Wisconsin cases is mainly due to a decline in Milwaukee County cases.
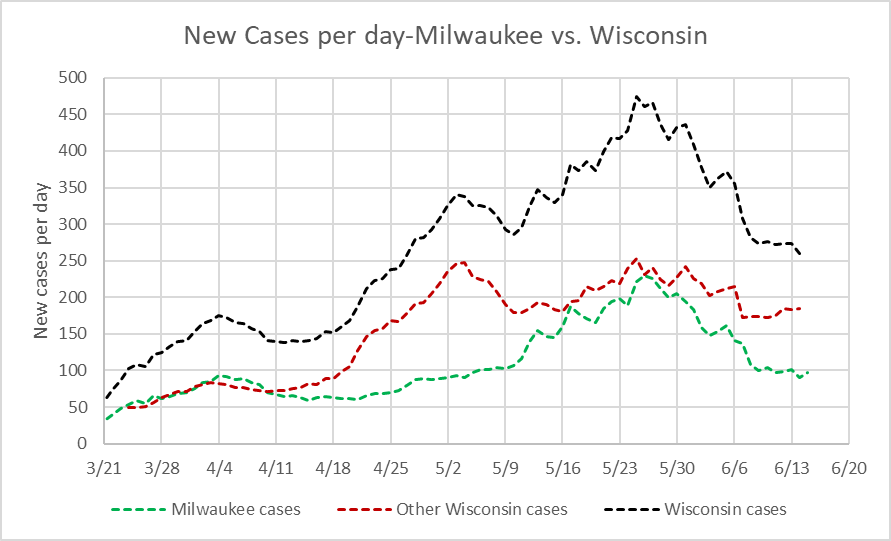
New Cases per day-Milwaukee vs. Wisconsin
The next chart shows the number of deaths per day for Milwaukee County (again in green) and the rest of Wisconsin. The peak in early April was mainly due to Milwaukee. Since then, Milwaukee has seen a gradual decline in deaths.
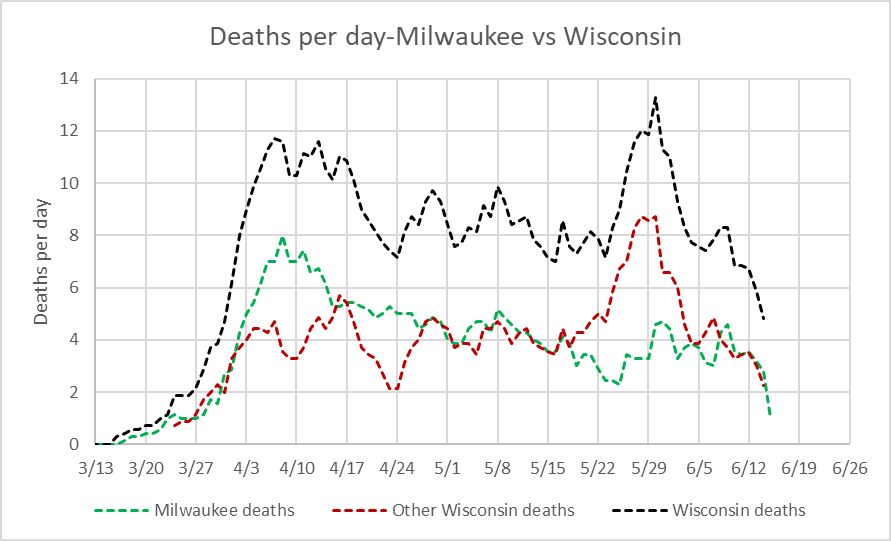
Deaths per day-Milwaukee vs Wisconsin
Half of Wisconsinites live in the eight largest counties. The next chart compares the daily new cases in those eight to the rate in the 64 smaller counties. It is clear that, initially at least, lower populations offered some protection from the coronavirus. However, cases have seen a slow, but steady rise in the smaller counties even as they are dropping in the bigger counties.

New Cases per day–Big and Small Counties
The next compares deaths in Wisconsin’s big and small counties. In the latter, deaths have held fairly steady at around two per day.
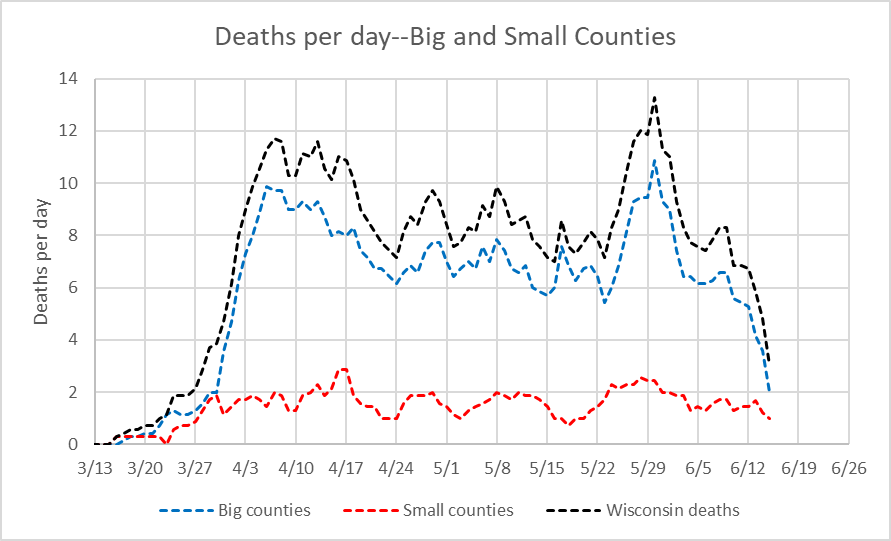
Deaths per day–Big and Small Counties
The Covid Tracking Project (associated with the Atlantic magazine) reports on the numbers of tests and how many were positive and negative. The next graph shows the number of tests (expressed as tests per 100,000 inhabitants in the state). It also shows the recommendation from the Harvard Global Health Institute (red dashed line) and the goal in Gov. Tony Evers plan for Wisconsin. The current rate of testing exceeds the Harvard recommendation and is close to the Evers goal. The recent slight decline in the testing rate may suggest that the demand for tests is being satisfied.
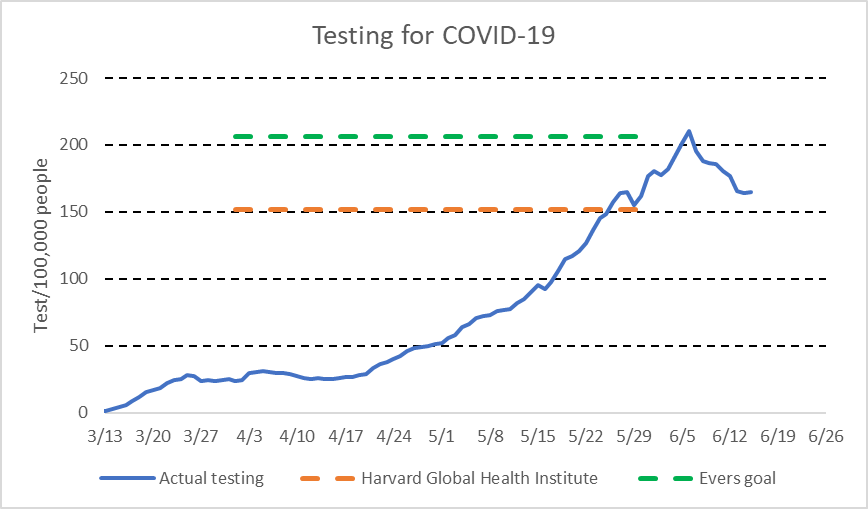
Testing for COVID-19
As testing increases, two effects are expected. One is that more infections will be discovered, causing an increase in the reported number of cases.
The second expected effect is that the percentage of positive results—showing that the person has COVID-19—will go down as the rules about who gets tested become more liberal. As the next graph shows, since early May the percentage of positive tests in Wisconsin has declined from around 10 percent to under 3 percent.
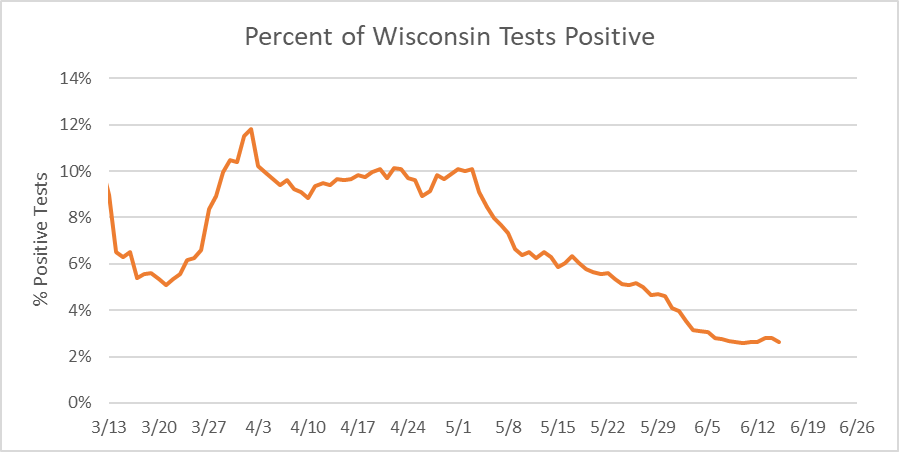
Percent of Wisconsin Tests Positive
Lacking a plan to randomly test a sample of the Wisconsin population similar to Germany and other nations, the state’s most recent figure of 2.6 percent testing positive represents something of an upper bound on the percentage of Wisconsinites exposed to the coronavirus. This comes as bad news to those hoping that herd immunity is a possible remedy. Typically, herd immunity is estimated to require around 60 percent to 70 percent exposure— and that assumes that exposure to this particular virus leads to immunity.
It is widely believed that our present case and death estimates undercount the actual impact of the disease. Deaths may be attributed to other causes, especially because people with other health problems are most likely to die from COVID-19. And people who contract the virus but never go to the hospital may not be counted.Because of these limitations, some use an “excess deaths” approach to estimate the number of deaths the disease cost. In theory, this approach is simple. Start by getting the number of deaths in several “normal” years—years with no major plagues or other disasters. Average these deaths to get “expected deaths” for every week. Subtract these expected deaths from the actual deaths during the pandemic. These are then the “excess deaths” attributable to the pandemic.
Using this approach, the New York Times produced a comparison of the effect of the pandemic on various cities and countries and how they fit with other disasters. For example, the Times estimated that COVID-19 caused almost six times the normal number of deaths when it struck New York City.
This approach seems to work well in situations where the effect is very large. But where the magnitudes of normal variations in death rates are similar to those of the pandemic the results may be less meaningful. This can be seen in the next plot, created from data developed by the Economist magazine.
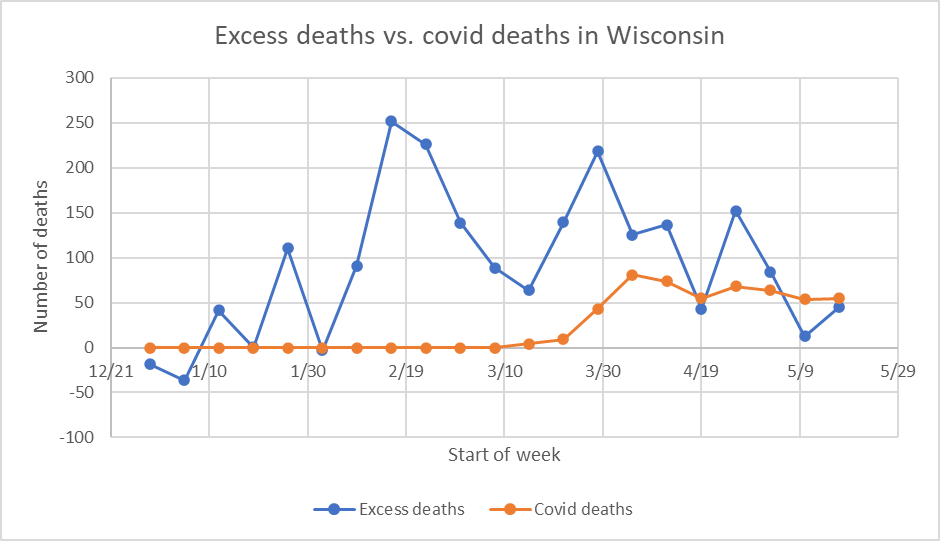
Excess deaths vs. COVID-19 deaths in Wisconsin
In many ways, Wisconsin appears to be making progress against the pandemic. New cases are decreasing, deaths are going down, testing is up, and the percentage of positive tests is down. The COVID Tracking Project gives Wisconsin a grade of A+ based on the quality of its data reporting.
There are certainly things that create concern for the future. Most obviously is the question of whether the crowds protesting the death of George Floyd will lead to a new virus spread. On the plus side, most protestors are wearing masks, they are outdoors, and they skew young, suggesting that any infections will not be life threatening.
This represents something of a turnaround for Wisconsin. As recently as late-May, this state appeared on many of the lists of states likely to face a resurgence of COVID-19. Thus, there is no guarantee of continued success.
For contrast, one need only look at three states which were recipients of pressure from President Donald Trump: North Carolina, where the Republican Convention was originally scheduled; Florida, which will get parts of the Republican Convention including the president’s acceptance speech; and Oklahoma, which will host a Trump rally later in June. All three states are facing increased COVID-19 even without the Trump-oriented events.
The chart below shows the daily number of new cases per 100,000 population for all three states and Wisconsin. Given the recent rise in North Carolina cases (shown in green), one can understand Governor Cooper’s unwillingness to accommodate President Trump’s dangerous demands for the Republican Convention. Likewise, Florida is seeing an upsurge of cases. Why would that state’s governor want to encourage an irresponsible Republican convention?
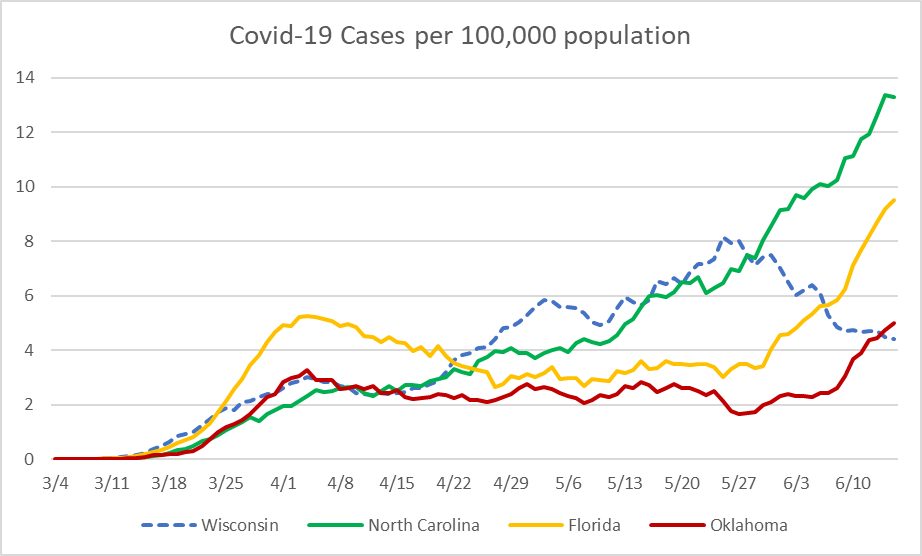
COVID-19 Cases per 100,000 population
Oklahoma, which has enjoyed a low infection rate so far, has seen it rise lately. The reservation form for Trump’s Tulsa rally includes this language:
By clicking register below, you are acknowledging that an inherent risk of exposure to COVID-19 exists in any public place where people are present. By attending the Rally, you and any guests voluntarily assume all risks related to exposure to COVID-19 and agree not to hold Donald J. Trump for President, Inc.; BOK Center; ASM Global; or any of their affiliates, directors, officers, employees, agents, contractors, or volunteers liable for any illness or injury.
Although there is considerable evidence that Wisconsin is making progress against the coronavirus, dangers remain. Perhaps the biggest source of danger in spreading the disease comes from other states and the Trump administration.
More about the Coronavirus Pandemic
- Governors Tony Evers, JB Pritzker, Tim Walz, and Gretchen Whitmer Issue a Joint Statement Concerning Reports that Donald Trump Gave Russian Dictator Putin American COVID-19 Supplies - Gov. Tony Evers - Oct 11th, 2024
- MHD Release: Milwaukee Health Department Launches COVID-19 Wastewater Testing Dashboard - City of Milwaukee Health Department - Jan 23rd, 2024
- Milwaukee County Announces New Policies Related to COVID-19 Pandemic - David Crowley - May 9th, 2023
- DHS Details End of Emergency COVID-19 Response - Wisconsin Department of Health Services - Apr 26th, 2023
- Milwaukee Health Department Announces Upcoming Changes to COVID-19 Services - City of Milwaukee Health Department - Mar 17th, 2023
- Fitzgerald Applauds Passage of COVID-19 Origin Act - U.S. Rep. Scott Fitzgerald - Mar 10th, 2023
- DHS Expands Free COVID-19 Testing Program - Wisconsin Department of Health Services - Feb 10th, 2023
- MKE County: COVID-19 Hospitalizations Rising - Graham Kilmer - Jan 16th, 2023
- Not Enough Getting Bivalent Booster Shots, State Health Officials Warn - Gaby Vinick - Dec 26th, 2022
- Nearly All Wisconsinites Age 6 Months and Older Now Eligible for Updated COVID-19 Vaccine - Wisconsin Department of Health Services - Dec 15th, 2022
Read more about Coronavirus Pandemic here
Data Wonk
-
Who Do You Trust to Conduct Elections Fairly?
 Apr 6th, 2026 by Bruce Thompson
-
Is Non-Citizen Voting a Real Threat to Elections in Wisconsin?
Mar 18th, 2026 by Bruce Thompson
-
How Global Climate Change Affects Milwaukee
 Mar 11th, 2026 by Bruce Thompson