
Comparing Wisconsin and Minnesota
Minnesota doing worse? MacIver cherry picks data to make this claim.

Prescott, Wisconsin, is just cross the St. Croix and Mississippi rivers from Minnesota. Photo is in the Public Domain.
Under the title, Wheels Have Fallen Off Liberals’ “Minnesota Is Utopia” Argument, the MacIver Institute’s Chris Rochester argues that:
Unfortunately for partisan hacks trying to pull a fast one on the mainstream media and the Wisconsin people, there is now plenty of evidence that the conservative fiscal policies enacted under Gov. Walker have pushed the Badger State right past Minnesota since 2011.
Rochester’s paper is largely a response to a study from the Economic Policy Institute (EPI) arguing that “Minnesota’s economy has performed better for working families than Wisconsin’s” since 2010 based on eleven metrics—jobs, unemployment, labor force participation, wages, wage trends by gender, household and family income, poverty, health insurance, GDP (gross domestic product), and population.
In his attack on the EPI, Rochester concentrated on a subset of the metrics as shown by the table below.
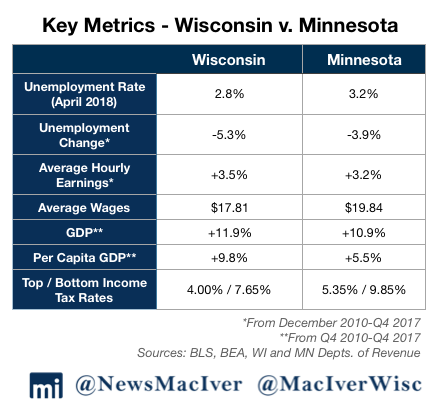
Key Metrics – Wisconsin v. Minnesota
Jobs
Notably absent from Rochester’s critique is a comparison of jobs in the two states. This absence is striking given that Walker’s promise to add a quarter million private sector jobs was fundamental to his election. The omission is perhaps unsurprising but dishonest. Compared to Walker’s promise that if elected governor he would create 250,000 new jobs in his first term, Wisconsin actually saw about half the promised jobs hike.
A number of Wisconsin’s neighbors, including Minnesota, did better. The next graph shows the number of jobs in Wisconsin (in red) versus those in Minnesota (in blue) between January 1990 and July of this year. Minnesota has a smaller population, but has been closing the gap, particularly during the Walker years.
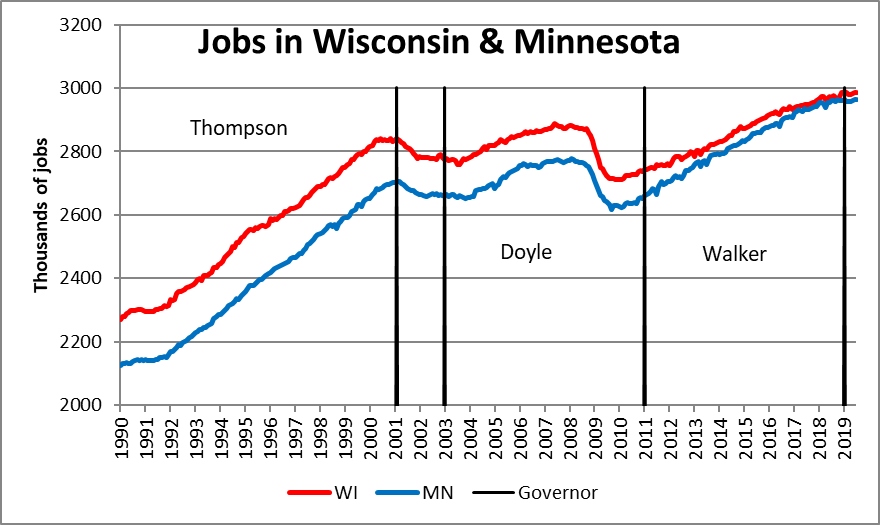
Jobs in Wisconsin & Minnesota
As the next chart shows, Wisconsin job growth during the Walker era underperformed the expected level if it kept the previous relationship with neighboring states’ jobs. Predicted jobs in the chart are based on regressing Wisconsin jobs against those in six neighboring states–Illinois, Michigan, Ohio, Indiana, Minnesota, and Iowa for the Thompson–McCallum–Doyle era between 1990 and 2011. The coefficient of determination for this regression is .999, meaning that the equation accounts for 99.9% of the variation over these 21 years.
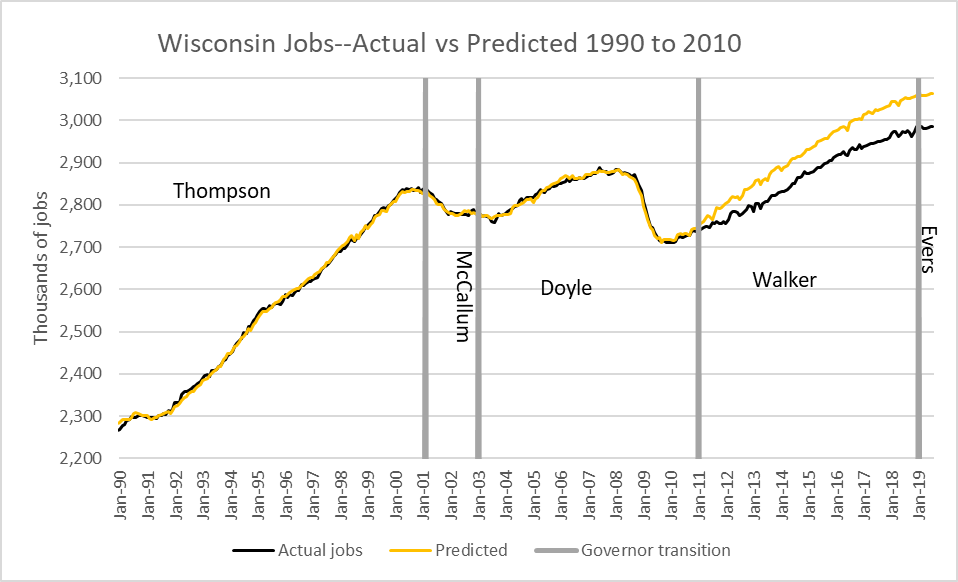
Wisconsin Jobs–Actual vs Predicted 1990 to 2010
As the chart above shows, between 1990 and 2011, it is possible to get an excellent fit using only jobs data from the six neighboring states. Adding in the Walker-era data, makes the fit break down. The resulting regression under-estimates job growth during the Doyle years and over-estimates jobs during Walker’s term. One way to fix the problem is adding another variable—the time since Walker took office. Doing this leads to the suggestion that every month in office cost the state 932 jobs.
Thus, Wisconsin under Walker adds to the evidence that so-called “supply-side economics,” the premise that low taxes (particularly on high earners) are the secret to job growth, is not supported by evidence. It is probably wishful thinking, however, to expect MacIver Institute folks to learn anything from this experiment. Their commitment to the theory outweighs their commitment to evidence.
Unemployment rate
Probably the strongest argument for Wisconsin’s economic superiority is the behavior of the unemployment rate. The next chart shows the rate for Wisconsin (in red), Minnesota (blue), and the US (black) from the start of the Great Recession to today.
At the height of the recession Minnesota’s rate was about a point lower than Wisconsin’s and started to decline earlier. It fell to 3.6 percent in 2015, several years earlier than Wisconsin, but then it stalled. What accounts for the strange behavior of Minnesota’s unemployment rate?
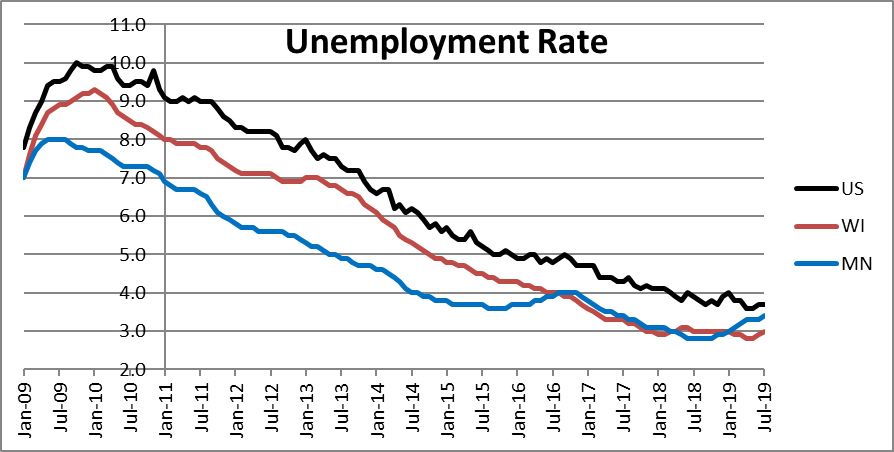
Unemployment Rate
Traditionally, economists believed that there was a “natural unemployment rate” that reflected the normal churn in employment in a “full employment” economy. High school and college graduates and people leaving a job might take a while to consider their options before accepting a job offer. Commonly, economists assumed a natural rate around 4.5 percent to 5 percent, well above the current Wisconsin or Minnesota rate, or even that of the nation.
The next chart shows the net migration rates for Wisconsin and Minnesota taken from Governing and Business Insider magazines. Note that Minnesota’s numbers are positive: more people moved to Minnesota than left. Meanwhile, Wisconsin’s are negative, so that there was a net outflow. If people without jobs are more likely to move to another state, unemployment in the sending state, such as Wisconsin, would likely go down, while that in receiving state would rise.
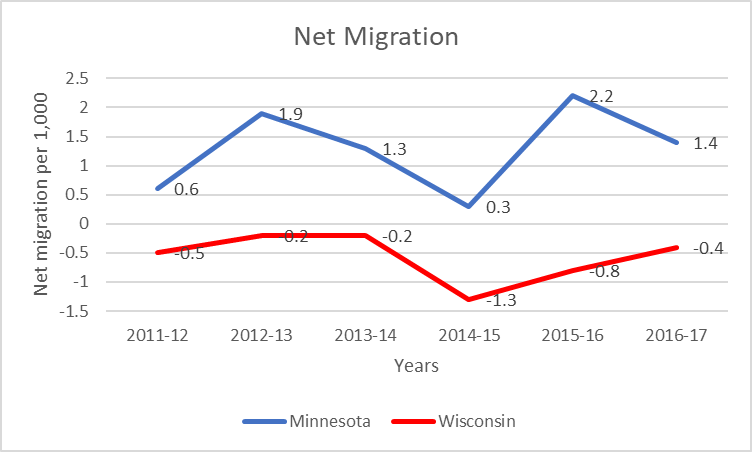
Net Migration
State GDP
The next chart shows the gross domestic product (in 2009 dollars) for Wisconsin and Minnesota. For years Minnesota’s GDP has been growing faster than Wisconsin’s, as has its population. (These numbers come from the U.S. Bureau of Economic Analysis through the Federal Reserve Bank of St. Louis’ FRED database).
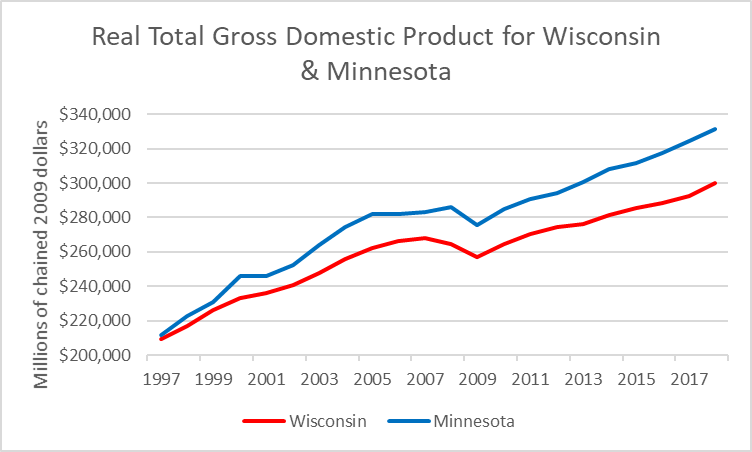
Real Total Gross Domestic Product for Wisconsin & Minnesota
During the Walker administration, Minnesota continued to gain on Wisconsin in population (rising 3.6 percent versus 1.3 percent in Wisconsin) and GDP (up 10.2 percent in MN versus 6.6 percent in WI) and GDP per capita as shown in the table below.
| Population (millions) | GDP (millions of $) | GDP per capita | ||||
| Wisconsin | Minnesota | Wisconsin | Minnesota | Wisconsin | Minnesota | |
| 1/1/2012 | 5,720 | 5,377 | 274,344 | 294,297 | $47,963 | $54,737 |
| 1/1/2017 | 5,792 | 5,568 | 292,477 | 324,264 | $50,496 | $58,235 |
| Percentage growth | 1.3% | 3.6% | 6.6% | 10.2% | 5.3% | 6.4% |
State Income Tax
Finally, the MacIver chart at the top of this column, reports Wisconsin vs. Minnesota tax rates, but does not discuss them. Two questions to ask about any state’s tax system are:
- Is it fair, or does it place most of the burden on those who can least afford to pay?
- Does it sufficiently fund public needs?
State and local governments mostly depend on three types of taxes: sales, property, and income taxes.
Of these, sales taxes are the most inherently regressive: they normally take a much larger share of the income of low-income families than of wealthy families. This reflects the fact that as income goes up, a larger and larger share goes to savings and purchases, such as services, on which no tax is paid. As the next graph (based on data from ITEP–Institute on Taxation and Economic Policy) shows, both states’ sales taxes follow this rule. The top 1 percent pay 0.8 percent of their income in sales taxes in both states; the bottom 20 percent pay 6.5 percent in Minnesota and 5.8 percent in Wisconsin.
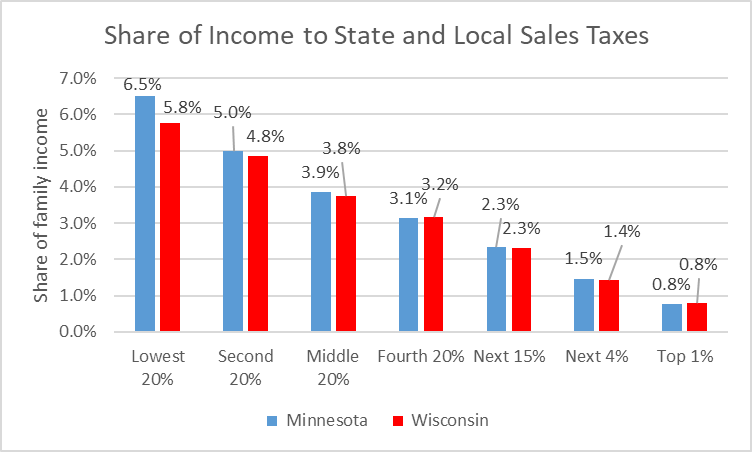
Share of Income to State and Local Sales Taxes
Property taxes are also regressive in both states but less so than sales taxes, as shown in the graph below. Wisconsin property taxes are both higher and more regressive than Minnesota’s.
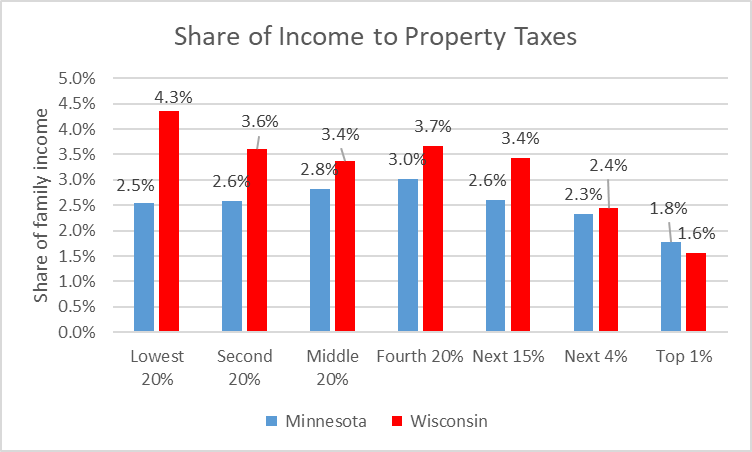
Share of Income to Property Taxes
Progressive income taxes can be used to compensate for the natural regressiveness of sales and property taxes. As the next graph shows, Minnesota’s income tax is more progressive than Wisconsin’s.
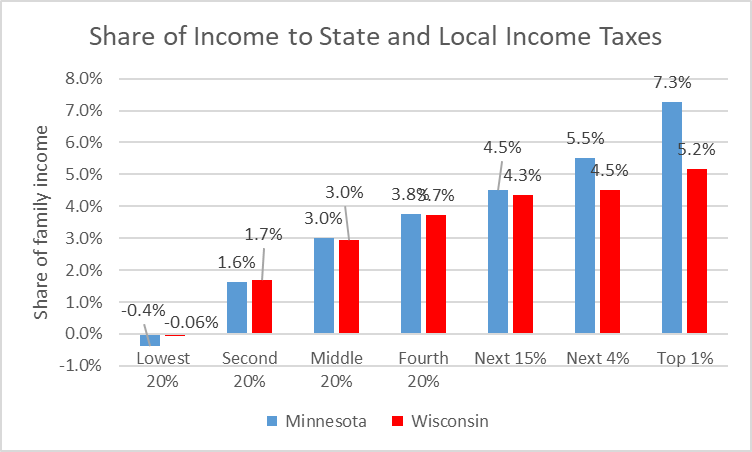
Share of Income to State and Local Income Taxes
When all state and local taxes are considered, ITEP concludes that Wisconsin has the 34th most unfair state and local tax system in the country, better than most, but well below Minnesota’s at 47th. As the next graph shows, in Wisconsin the top 1 percent pay 7.7 percent of their income in taxes, compared to over 10 percent for the 60 percent in the middle. By contrast, Minnesota comes close to a flat tax system, with people at most income levels paying about 10 percent of their income.
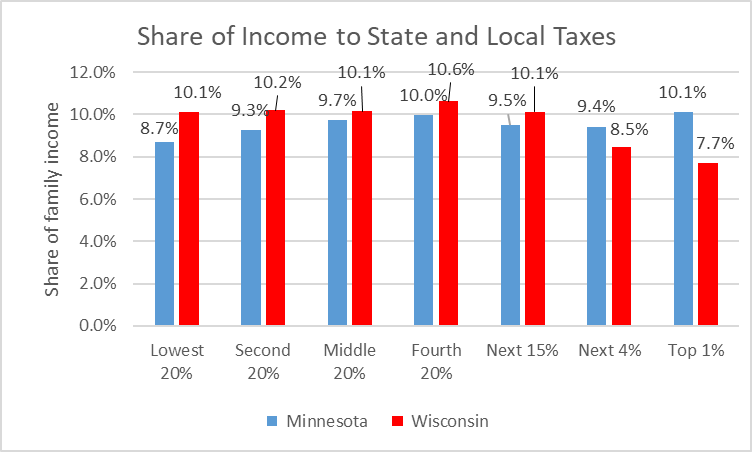
Share of Income to State and Local Taxes
According to estimates from the US Census, between the 2nd quarter of 2018 and the first quarter of this year, Wisconsin state and local governments collected $19 billion in taxes and Minnesota collected almost $27 billion. In other words, Minnesota and its local governments have almost $8 billion more —or 42 percent– to spend on public goods.
This difference likely contributes to the poor condition of Wisconsin’s transportation infrastructure (US News ranks Minnesota 4th and Wisconsin 32nd). Likewise, many of the struggles of local governments to adequately fund parks or bus services stem from the attitude that low taxes are the secret to prosperity.
MacIver’s staffers like to view themselves as journalists, an idea reinforced by the “NewsMacIver” label. This position would be much more credible if they were willing to incorporate any contrary evidence into their analyses.
Data Wonk
-
Who Do You Trust to Conduct Elections Fairly?
 Apr 6th, 2026 by Bruce Thompson
-
Is Non-Citizen Voting a Real Threat to Elections in Wisconsin?
Mar 18th, 2026 by Bruce Thompson
-
How Global Climate Change Affects Milwaukee
 Mar 11th, 2026 by Bruce Thompson


Having lived in Minnesota for 20+ years and now back in Wisconsin, I can tell you the tax burden in Minnesota is less onerous that Wisconsin’s. Here is why, Minnesota roads are in much better shape overall than Wisconsin. This resulted in lower car maintenance costs. While still significant problems with law enforcement in both states, Minnesota’s is better funded than Wisconsin thus resulting in less crime. This translates into lower auto and homeowner insurance premiums. Schools are better funded and public transportation is far superior translating into more companies relocating to Minnesota bringing more and better jobs to the state. Finally, Minnesota takes a more progressive stance on health care including fully implementing the ACA. Result, significantly lower insurance premiums, co-pays and out of pocket expenses than in Wisconsin.
Bottom line, while Minnesota tax rates may be higher than Wisconsin, Minnesotans get much more value for their tax dollar.