
Comparing Badger Economy to Border States
Wisconsin does both better and worse than neighboring states.

2008 Badger Boys State. Photo is in the Public Domain.
Every month, the US Bureau of Labor Statistics issues a number of economic reports that are closely watched. When they are good, many office holders, including Wisconsin’s Governor Scott Walker and President Donald Trump, are quick to claim credit. When bad, they must be due to random sampling error—or outside influences over which the office holder has no control.
Most economists agree that governors and presidents deserve less credit or blame for economic conditions than voters often assign to them. That said, it is useful to stand back and look at the trends. In this column I look at statistics for Wisconsin and its neighbors, Michigan, Minnesota, Illinois, and Iowa.
The first chart plots percentage of non-farm job growth since January 2011 in the five states, as well as the United States as a whole. It comes from the bureau’s survey of employers (the “establishment survey”) and was retrieved from the Federal Reserve Bank of St. Louis’ FRED site.
I chose January 2011 as the starting point for several reasons. It is when Walker took office. In winning his election, he made several economic promises, most notably that his promised policies would lead to an additional 250,000 private sector jobs in his first term.
It was also the start of the second year of recovery from the Great Recession. Around the start of 2010, the nation and most states had stopped shedding jobs and were increasing employment.
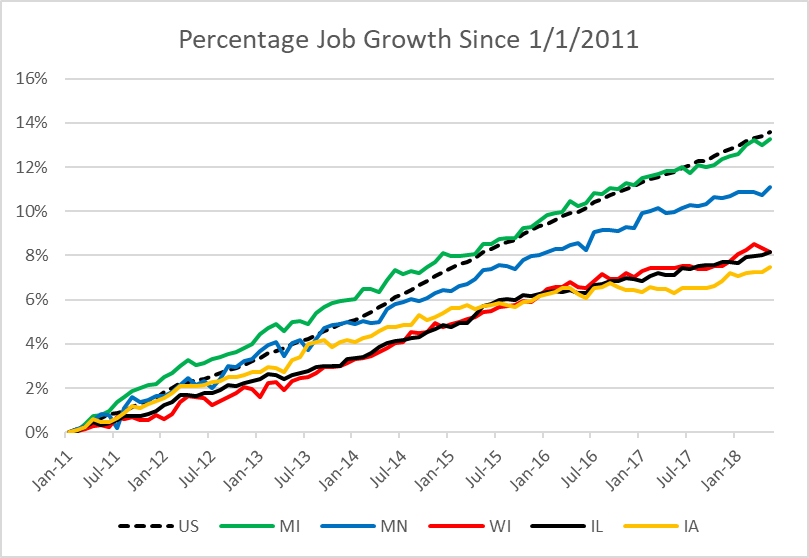
Percentage Job Growth Since 1/1/2011
It is worth stressing once more that many factors probably play a more significant role in job growth than their governors. For example, Michigan’s strong growth likely reflects the recovery of the American automobile industry. In measuring growth over a period time, the result is greater if the starting point is smaller.
Iowa’s relatively good job growth early in the period is typical of other Great Plains states in which agriculture played a major role. During the recession the region did quite well, but so did other agricultural economies because of the demand from countries like China. More recently the market for agricultural products has been weak. A similar pattern has been typical of states heavily dependent on energy production.
Minnesota has had solid job growth during this period, despite polices that violate conservative orthodoxy. Advocates of conservative economic policies can point to Indiana (not shown on the chart because it does not border Wisconsin) whose job growth closely approximates Minnesota’s.Illinois and Wisconsin have had very similar job growth during this period. As I described in a recent article, Illinois has been hampered by its inability to settle on a strategy to fund its public pensions. Despite this, the latest figures put Illinois and Wisconsin in a virtual tie.
From a political viewpoint, Illinois and Wisconsin suffer from opposite problems: Illinois has an impasse between its Democratic legislature and very conservative Republican governor. In contrast, all three branches of Wisconsin government (four if the Supreme Court is counted) are controlled by Republicans.
As the next graph shows, the unemployment rate has come down in all five states along with the national rate. The unemployment rate is calculated from a different survey—the “household survey”—in which a sample of households are contacted and asked whether they are working or looking for work. The percentage of those not working but looking is calculated as the unemployment rate.
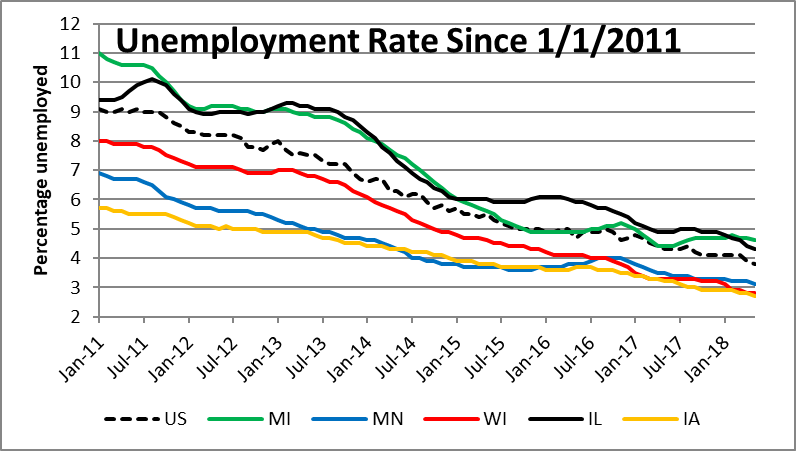
Unemployment Rate Since 1/1/2011
The unemployment rate can go down for several reasons. First, people who were looking for a job may have found one. However, it also goes down if people looking for a job leave the work force by giving up, becoming students, or moving to another state. Despite its job growth, Michigan has the highest unemployment rate of the five states, likely reflecting the lingering impact of the near collapse of auto manufacturing during the recession.
Iowa, Wisconsin, and Minnesota have the lowest unemployment rates. With the first two, this is despite relatively weak job growth. Perhaps this reflects a willingness of job seekers to look elsewhere.
The next graph shows the growth in the labor force in the five states and the US. The labor force is calculated from the household survey and is used in calculating the unemployment rate. Despite percentage job growth about equal to Wisconsin’s, Illinois shows a somewhat surprising shrinkage in its labor force.
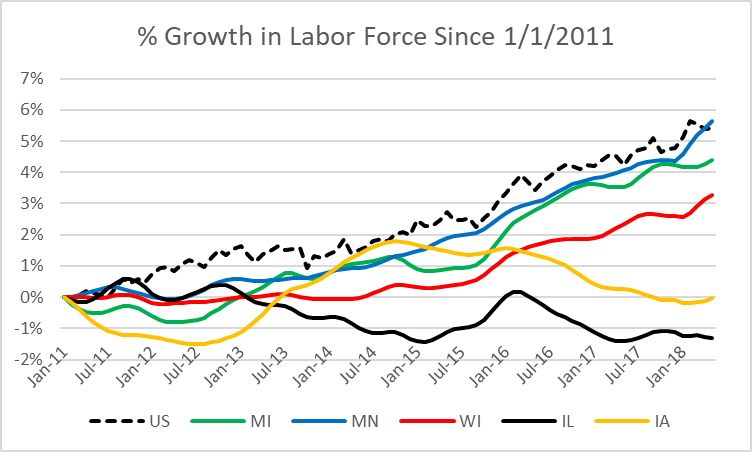
% Growth in Labor Force Since 1/1/2011
Generally the labor force numbers follow the track that one would expect: as more people get jobs and unemployment decreases, the labor force increases. Two—Iowa and Illinois–however, follow somewhat puzzling paths.
My guess is that the recent decline in the Iowa labor force reflects weakness in agriculture leading to an exodus as people look for employment elsewhere. That would not explain the earlier decline followed by a rise which is especially puzzling considering Iowa’s relatively strong job growth.
That leaves Wisconsin and Illinois. Considering that the rate of job growth has been similar in both states, the recent divergence in labor force growth is puzzling. Of course, one should remember that the jobs numbers come from one survey (of employers) and the other two from another (of households).
The consensus among economists is that governors receive more credit for a good economy—or blame for a bad one—than they deserve. The evidence from the five states tends to support this consensus. In the short run, at least, politics matters less to prosperity than the attention to politics suggests.Underlying factors—Minnesota’s higher education levels, the automobile industry recovery, world commodity prices, a state’s underlying culture—may have more impact on a state’s economy than its tax rates or subsidies to companies.
Is it fair then for people eager to replace Walker to blame him for Wisconsin’s mediocre economic performance? One answer is that he made job growth an issue when he promised to add 250,000 jobs in his first term. It is fair for him to change the subject when his promise is broken?
Another approach is to look at whether a governor is working to change the underlying factors in a more favorable direction. For example, an April Medicaid expansion memo from the nonpartisan Wisconsin Legislative Fiscal Bureau calculated that Walker’s decision to reject Medicaid expansion funds cost the Wisconsin taxpayers over one billion dollars over the past six years. Rather than rejecting this money could it have been used to improve Wisconsin’s underlying strengths? How far would it have gone, for instance, if used to reduce Wisconsin kids’ exposure to lead?
Data Wonk
-
Who Do You Trust to Conduct Elections Fairly?
 Apr 6th, 2026 by Bruce Thompson
-
Is Non-Citizen Voting a Real Threat to Elections in Wisconsin?
Mar 18th, 2026 by Bruce Thompson
-
How Global Climate Change Affects Milwaukee
 Mar 11th, 2026 by Bruce Thompson


New York Times has a great article on disability insurance. Since Trump became president 300,000 disabled people are back to work. Disability supposed to run out of money in 2023 has now been pushed back to 2032.
The same Trump who loves to mock people with disabilities? New York Times is fake news say you and your fellow white supremacists so it can’t be true. You can’t only trust stories you like.
Wage growth is another major factor of economic well-being of a state. This data from Governing Magazine includes median and average hourly wages through 2016 – http://www.governing.com/gov-data/wage-average-median-pay-data-for-states.html. Here are the trends from 2011-2016 for average hourly wages:
IL … $22.38 (2011), $24.76 (2016), 10.6% growth
IA … $18.66, $20.93, 12.2%
MI … $21.01, $22.76, 8.3%
MN … $22.19, $24.68, 11.2%
WI … $19.92, $21.75, 9.2%
These numbers are grim for Wisconsin. Average wages in Wisconsin are lower than all states than Iowa, and Iowa beats Wisconsin on wage growth since 2011. Wisconsin’s wage growth is lower than all states except Michigan, which still easily beats Wisconsin for average wage.
Wage growth, Starbucks is closing 150 stores. Where you ask? Mainly forced city wage zones in urban areas. You see Starbucks can simply close and not pay $15 an hour.
We luv reading all this crap from people who could not run a whore house in Yukon at height of Gold Rush.
Fact. These people run Milwaukee; worst schools in country, worst managed city, top ten worst crime, abandoned homes, corruption, high taxes, spends money on toys while crime explodes, lousy roads, carjackings, drugs galore, mob drug gangs kill people, worst poverty and then they ran the state into ground.
Now they want to run the state again.
WCD: Your messiah’s grandpappy made his fortune running brothels and bootleg booze during the Klondike God Rush while he ran away from his nation’s mandatory military duty. Sheesh. Get your idol’s history straight. You are unable to even do that correctly, old geezer