
Why Is City’s Student Achievement So Low?
NAEP results show notable progress in Chicago, but discouraging results here.
Milwaukee Public Schools Office of School Administration, 5225 W. Vliet St. Photo courtesy of Milwaukee Public Schools.
A recent Washington Post article by Arne Duncan argued against the view that education reform hasn’t worked very well: “while today’s kids bring more learning challenges, they perform as much as 2½ grades higher than their counterparts from half a century ago.” Duncan, Education Secretary during much of the Obama administration, is hardly a neutral observer, but the evidence backs him. Overall national scores on the National Assessment of Educational Progress (NAEP) on 4th and 8th grade reading and math exams have risen substantially since 1971.
Unfortunately, this improvement has largely skipped Wisconsin. An analysis from the Wisconsin Reading Coalition finds that:
All Wisconsin racial, economic status, and disability status sub-groups perform below the national average for that sub-group
Wisconsin African-American students rank 49th among black students in the country and Wisconsin white students rank 41st (behind Alabama and Mississippi) among white students
The coalition finds that Wisconsin has dropped from third place on the 4th grade NAEP exam in 1994 to 34th place on the recently released 2017 results. This decline was entirely due to the improvements in other states’ results. I may have more to say about the state in future columns, but here will concentrate on Milwaukee versus Chicago, whose results show that an urban school district can see improvements in results.
In a report issued late last year, Stanford’s Center for Education Policy Analysis rated Chicago schools as the nation’s most effective large city school system:
A comparison of Chicago public school students’ standardized test scores in 2009-2014 with those of public students across the U.S. reveals two striking patterns. First, Chicago students’ scores improved dramatically more, on average, between third and eighth grade than those of the average student in the U.S. … Second, at each grade level in grades three through eight, Chicago students’ scores improved more from 2009 to 2014 than did the average scores of all students in the U.S.
The approach taken by the Stanford group was to compare the scores on the 8th grade exams to the scores for the same cohort of students when they took the exam four years earlier (five years earlier in the case of the Illinois exam).
The next graph compares the average scores on the 4th grade reading exam given in 2013 with the 8th grade exam given in 2017, four years later. The blue line shows the average national score, the red line is for large cities, the gray line is the average for Chicago, and the yellow in for Milwaukee.
The Chicago cohort continues to follow the pattern found by the Stanford study, improving more than the average of all US students or those in large cities. By contrast, the average Milwaukee student started behind all students nationwide and remained behind.
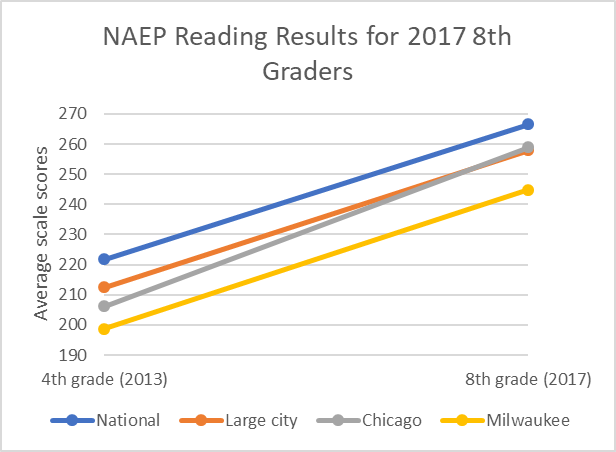
NAEP Reading Results for 2017 8th Graders
The same pattern is found when the results are broken out by ethnic group. As shown below, Chicago’s black students advanced more than their peers nationally and in other cities. By contrast, Milwaukee’s gap remained essentially unchanged. (The pattern for white and Hispanic students was much the same.)
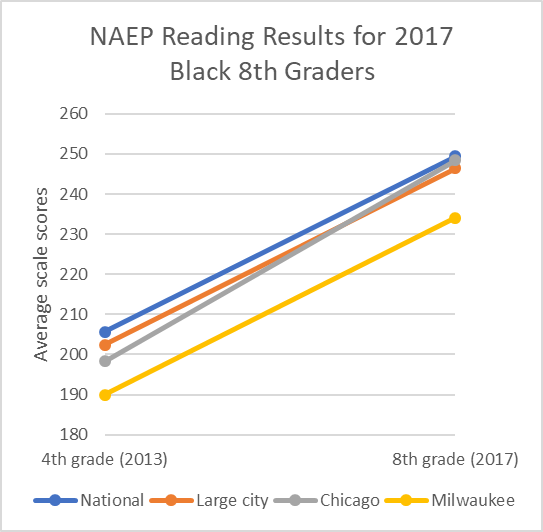
NAEP Reading Results for 2017 Black 8th Graders
On the math exam, Chicago students gained ground while Milwaukee students lost ground, as shown below:
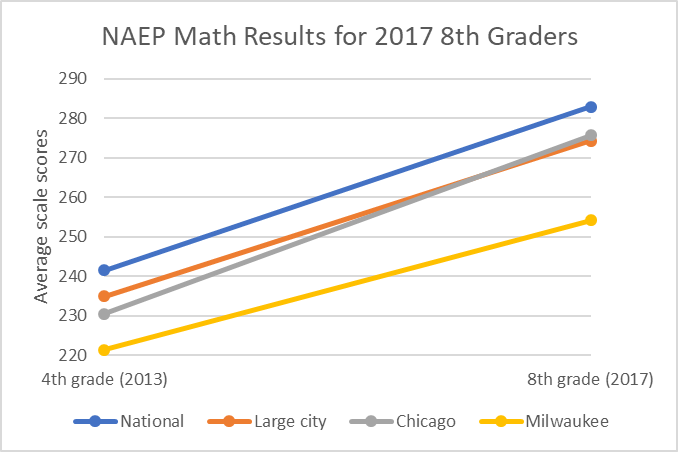
NAEP Math Results for 2017 8th Graders
While this effect was repeated when broken out by ethnic group, the gap between Milwaukee black students and those elsewhere was most dramatic.
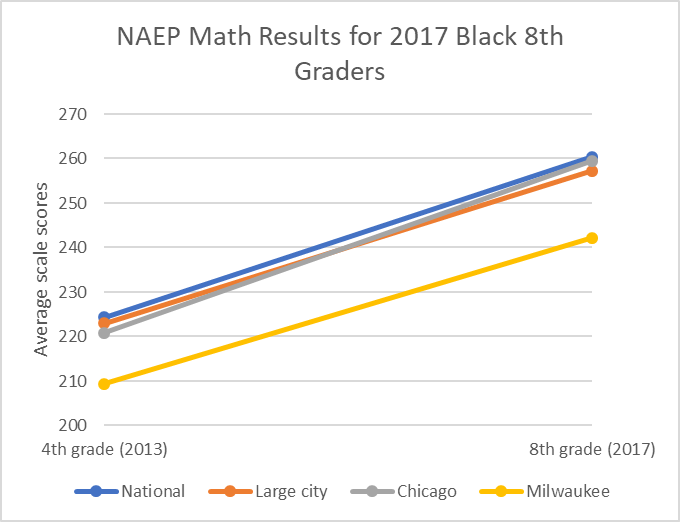
NAEP Math Results for 2017 Black 8th Graders
Looking at Hispanic students, Chicago’s advanced more compared to those elsewhere while Milwaukee’s fell behind.
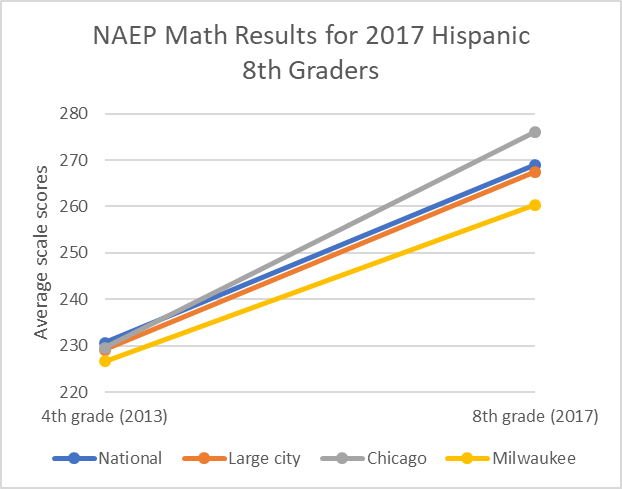
NAEP Math Results for 2017 Hispanic 8th Graders
The recently-released 2017 NAEP results are consistent with the Stanford study’s conclusion that students in Chicago advance more than students elsewhere. Most disturbingly, they also point to the need to search out the causes for Milwaukee’s gap.
Various reasons have been advanced to explain why so many Milwaukee students have trouble with their education. These include the trauma that students experience with neighborhood violence, the effect of lead poisoning, family instability and evictions and the loss of manufacturing jobs, pessimism from growing up in a stressed-out environment and drug dealing.
However, these factors don’t go very far in explaining why Chicago schools outperform Milwaukee and other American cities. The factors that purport to explain Milwaukee’s lagging performance, from lead poisoning from old paint to neighborhood violence would be expected to have at least as strong an effect on Chicago. What is different about Milwaukee? The biggest difference is leadership.
A headline, Milwaukee School Boss Walks Away, could have been written today. Instead, it is from the Christian Science Monitor in 1991, reporting the decision by then-MPS superintendent Robert Peterkin to quit his job. In the thirty years since 1988 when Peterkin was hired, MPS has had 10 superintendents: Peterkin, Hawthorne Faison (interim), Howard Fuller, Robert Jasna, Barbara Horton (interim), Alan Brown, Spence Korte, William Andrekopoulos, Gregory Thornton, and Darienne Driver, who recently announced that she was leaving.In contrast to MPS’ leadership churn, both the cities of Milwaukee and Chicago are notable for leadership stability. In Milwaukee, John Norquist took office in 1988 and left at the end of 2003, to be followed (after a few months with Acting Mayor Marvin Pratt), by Tom Barrett, who has now served 14 years.
Like Milwaukee, Chicago has had two elected mayors: Richard Daley between 1989 and 2011, followed by Rahm Emanuel. Unlike Milwaukee, the Chicago school superintendent reports to the mayor. Could this help account for the difference in outcomes?
One possible factor is a churn in policies with the turnover in superintendents and board membership. Incoming superintendents announce a fresh set of policies but leave before the policies can bear fruit. As a result, the district never learns what works and what does not. Was the policy dropped because it didn’t work or because it was viewed as someone else’s baby? Who knows?
A second possible mechanism is that mayoral control offers some insulation from political pressure against changes that may threaten the economic and political interests of various pressure groups. It is striking to me how much energy is expended in Milwaukee trying to prevent charter schools from expanding.
Whatever the reason behind Chicago’s better results in achievement, it is worth further exploration.
Data Wonk
-
Who Do You Trust to Conduct Elections Fairly?
 Apr 6th, 2026 by Bruce Thompson
-
Is Non-Citizen Voting a Real Threat to Elections in Wisconsin?
Mar 18th, 2026 by Bruce Thompson
-
How Global Climate Change Affects Milwaukee
 Mar 11th, 2026 by Bruce Thompson


I feel like I always have to ask when this comes up in discussion…You mean “charters” and those alone, and not “vouchers”, right? There is heavy (and likely rightful) resistance to the “voucher” program in MKE and it seems that quite often, “charters” get lost in the mix. The programs that are working should be expanded and maybe “charters” are the right path.
I think MPS ought to do *more* “charters” as well. They retain a much higher degree over their control and from their perspective the differences in whichever category one looks at must pale in comparison to losing students all together to “vouchers”.
Unfortunately, both have perhaps been implemented along with reduced pay/benefits/accreditation/etc for the teaching staff, as if that were the only problem to achieving a successful school.
Walker’s plan of crippling education is working! Make everyone dumb so he can grow his brainless voter base!
Disgusting, Dump walker. Dump the GOP.
Seems that one reason for Milwaukee schools under performing vs. Chicago that is not mentioned would be vouchers. If the more motivated parents and students are using vouchers to move out of the public school system, the public schools are left with the student base most likely to drag down performance numbers. If I read the article correctly, only public schools are surveyed here.
Of course this is one of the goals of the voucher program. Make it look like public schools are failing so the whole system can be privatized, thus creating another whole revenue stream for political contributions to candidates running for office.
Reading the data provided it seems that Milwaukee has risen at almost the same rate as other urban districts and Chicago since 2013. The only difference is the baseline.
Data Thompson then tells us the reason that MPS students are behind is because of leadership churn.
Hey numbers guy, I thought you were about giving data driven analysis. How can you quantify this leadership thingy?
And then we get to the answer in the last 2 paragraphs.
The “solution” is less democracy-Mayoral control and less worker control (unions)-charters.
The technocratic solution will always save us plebes I guess?
Leave it to the experts citizens.
Re: Chicago and its lack of “vouchers”. In that city, their “charters” are sometimes worse. I have only anecdotal evidence from a friend’s wife who briefly worked in one — it initially looked and felt like a step up to get in and have one’s own classroom until the realities of a fragile school structure with basically no support for the teachers kicked in and made it positively awful.
Milwaukee is more segregated and has a higher level of poverty than Chicago. And our state government has been cutting school funds since 2010. The best teachers have been leaving since act 10.
Ingrid, asking public employees to contribute to their own health insurance and pension must be such a hardship. If you ask our working poor public teachers to contribute to their own well being it is automatically an education cut. I went to see Black Panther the other day and it truly is fiction. Not one of the African American or Black Europeans characters was portrayed as a victim. They were strong and independent maybe MPS and its goon squad can use this movie as a teaching moment. You do not have to be a victim. Yes, you may not have been dealt the best poker hand in life but you can arise from your environment and be strong and independent.
1. I’m wondering if publicly funded Private and Parochial Schools results are included in these findings?
2. I’m also wondering if Students with Disabilities are included as well? Many Students with Disabilities do not perform well on Standardized Tests. #’s of kids with disabilities in the MPS System are also significantly higher than average because Private/Parochial Schools are not required to accept them.
Thanks.
Joe Kucak MSW, LCSW
“You can’t educate I for no equal opportunity…”
-The Honorable Robert Nesta Marley
The U.S. Department of Education projects that in 2021, private schools will enroll about 9 percent of preK-12 students, while public schools will enroll 91 percent.
Can we say that this a monopoly? Why does the left hate private monopolies and protects government monopolies?
In the end most residence of Milwaukee appear to be content with MPS?
$15,000 a pupil…the left always wants more!!!!
It is 11k per student AVERAGE and that includes money that goes to private schools (1). That is on average, the rates per school district depends on property tax base. That means rural and urban schools both have lower rates. In 2016-17, Brookfield spent $14,224 per pupil, well below the next lowest town, Granby, which spent $15,525 (2). The Milwaukee tax base is shrunk both by low income and by the amount of untaxed not for profit and religious property. At the same time the needs of urban and rural children living in poverty are higher including health and social workers.
1. http://archive.jsonline.com/newswatch/290328881.html
2. https://www.newstimes.com/local/article/Spending-per-student-still-low-in-Brookfield-12562051.php
Tax supported public education is an integral part of democracy since the founding of the United States. It ensures an educated populace and high literacy rate. It was also meant to bring all strata of society together, rich, poor, new and old immigrants to forestall the sharp delineation of classes like in England which is considered anti-democratic. A good read on the foundations of public schools.
https://en.wikipedia.org/wiki/History_of_education_in_the_United_States