
Does Tax Credit Make State a Winner?
An Econ professor and Walker fan uses shaky research to say yes.

Manufacturing
A recent Data Wonk column looked at claims from the Wisconsin Manufacturers and Commerce (WMC) about the job effect of the Wisconsin Manufacturers and Agriculture tax credit. WMC’s argument consisted of comparing two time periods, the first before the credit existed and the second after the credit kicked in. Since manufacturing employment shrunk in the first and grew in the second, the WMC argued that this proved the credit worked. What WMC failed to mention is that the first period included the Great Recession, when jobs of all kinds disappeared; the second was a recovery period, when jobs were increasing everywhere. To argue that the credit caused the difference seems a stretch, to put it mildly.
A somewhat more sophisticated approach was taken by Noah Williams, who teaches in the economics department at the University of Wisconsin. It was posted under the title The Impact of the Manufacturing and Agriculture Credit in Wisconsin.
In addition to his academic role, Williams is an enthusiastic supporter of Gov. Scott Walker. It appears that this latter role drove his analysis of the tax credit.
Williams’ approach was to pair Wisconsin border counties with their neighbor counties across the state line in Minnesota, Iowa, Illinois, and Michigan. Williams illustrates his approach with the table below, taken from his paper. This table shows the average annual manufacturing job growth before the credit (2002-12) and after it (2013-16) in both the Wisconsin border counties and their cross-border neighbors. It calculates the difference in growth rates between the two periods for each group of counties, concluding that the net improvement in the Wisconsin counties was 1.26 percent greater than that of its neighbors.

The average annual manufacturing job growth before the credit (2002-12) and after it (2013-16) in both the Wisconsin border counties and their cross-border neighbors.
It is worth noting that if this approach is applied to the five states as a whole, the result is reversed. In that case the net improvement in the Wisconsin counties was 1.23 percent smaller than that of its neighbors.
In his analysis, Williams applies this “difference of differences” approach to each of the county pairs. He then regresses the results to conclude that the tax credit produced 20,000 additional manufacturing jobs in Wisconsin. In assessing his analysis, I will look at two questions: whether using matched counties neutralizes the effect of other differences in counties and whether Williams’ conclusion is credible.
1. Does using county pairs neutralize the effect of other differences in counties?
Underlying Williams’ analysis is the implicit assumption that comparing contiguous counties eliminates other possible causes of variation in economic activity, leaving only the introduction of the tax credit. In other words, he assumes that the counties are identical except for differing state policies.
But how similar are the Wisconsin border counties to their out-of-state neighbors? Using census data from the Brookings Institution, I calculated three values for the Wisconsin border counties and their out-of-state neighbors: their average population, the percentage of people in urban areas, and their gross domestic product per resident.
- Population
The 23 neighboring state counties have about double the total population of the 21 Wisconsin counties to which they are compared (2.1 million vs. 1 million).
- Urban population
The Wisconsin counties are substantially less urban than the neighbor counties. The average Wisconsin border county is 35 percent urban, compared to 49 percent for the neighbor counties. If the average is weighted by population, it is 60 percent for Wisconsin and 79 percent for the neighbors.
The next graph shows the urban percentage for each match. The value for each Wisconsin county is shown on the horizontal axis and that for its match on the vertical. Not surprisingly, there is some relationship, as reflected in the trend line, but it still suggests the bordering counties vary greatly.
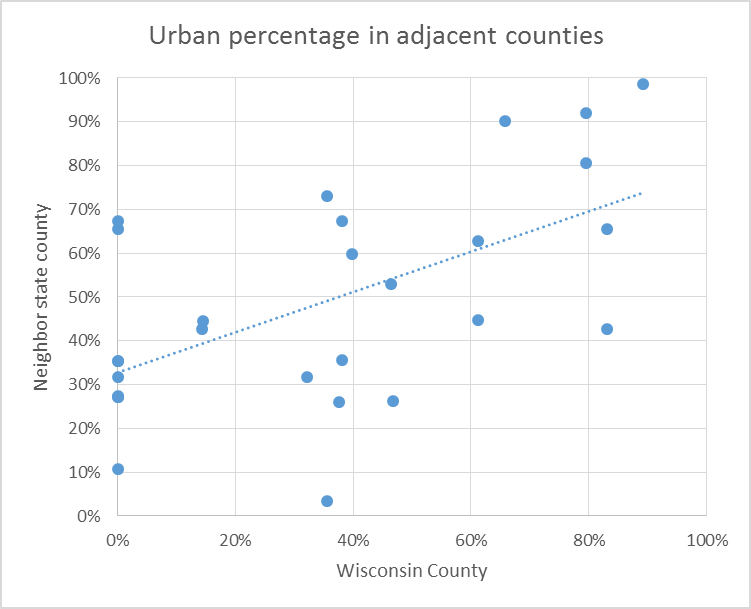
Urban percentage in adjacent counties
- Gross domestic product per capita
The neighboring counties also have substantially more gross domestic product per person. The weighted average for the Wisconsin counties is $43,000 compared to $54,000 for their matches, a difference of more than $10,000.
The next graph shows the GDP per capita for the paired counties. There is virtually no relationship between the GDP of each member of the pairs.

GDP per capita in adjacent counties
Williams, and others trying to measure the economic effect of policy changes, face one overwhelming challenge: how to separate the effect of a particular policy from the many other differences between states, or in this case, counties. It is evident that using matched pairs along the state border does not solve the challenge in most cases.
2. Is Williams’ conclusion credible?
Summarizing his results, Williams concludes:
I estimate that the cumulative impact of the MAC was that by September 2016 manufacturing employment in Wisconsin border counties was 6.6% higher and total employment 2.5% higher than they would have been in the absence of the tax credit. Applying these border-county estimates to the whole state suggests that since its introduction the MAC accounted for a total gain of over 20,000 manufacturing jobs (a 4.6% increase) and over 42,000 total jobs (a 1.8% increase) in Wisconsin.
Is this credible?
The next graph shows the historical record of manufacturing jobs since the start of 2008, for Wisconsin (blue solid line), Wisconsin’s four neighboring states (green line), and the US (red line). To fit all three on the same scale, the jobs were adjusted such that all three had a value of 100 in December 2012 (the last month before the manufacturing and agriculture tax credit kicked in).
The level of the tax credit is also shown on the chart, in yellow and using the right-hand scale.
Finally I show what Wisconsin manufacturing jobs would have looked like if there were no tax credit and Williams’ estimate that the credit accounted for 20,000 manufacturing jobs in September 2016 was correct. The blue dashed line shows Wisconsin manufacturing with the loss of the supposed jobs, starting in 2013 and growing every month until it rises to 20,000 in September 2016.
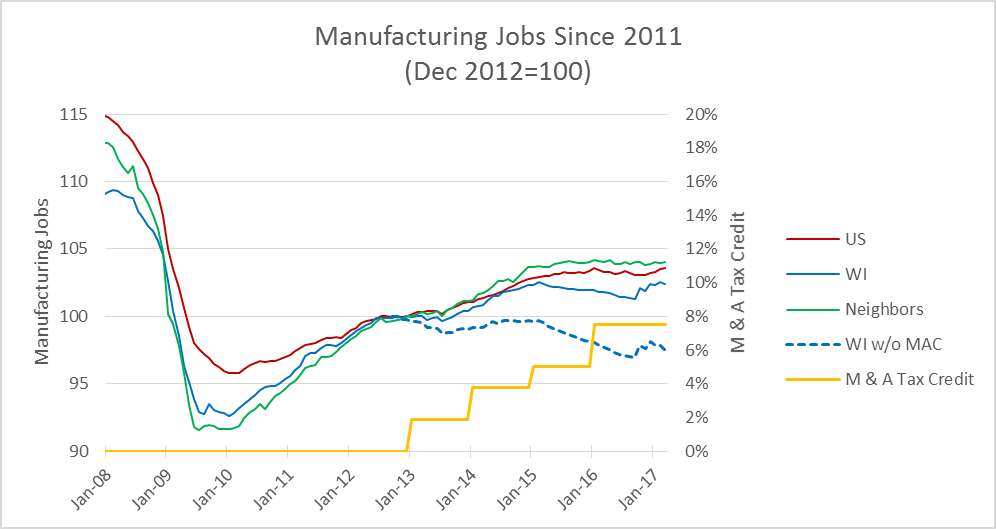
Manufacturing Jobs Since 2011 (Dec 2012=100)
Without the tax credit, Wisconsin would have experienced a substantial decline in manufacturing jobs even as the US and our four neighboring states enjoyed a small increase. It is likely that Williams would object to this conclusion. After all, he has been an adviser to Walker and written articles with titles like Under Scott Walker, Wisconsin Has Prospered–Keep That In Mind For 2016. However, that is the inevitable outcome of his conclusion.
Moreover, look at the solid blue line tracking the actual manufacturing job growth of Wisconsin: it is still trails the nation (in red) and that of neighboring states (in green). Williams is left to argue that without the tax credit, Walker’s leadership would have been dreadful for the state’s manufacturing sector, and even with the credit Wisconsin trails the nation and neighboring states. Williams might be better off not attempting this comparison to border states, as it only hurts the cause of the governor he champions.
Data Wonk
-
Who Do You Trust to Conduct Elections Fairly?
 Apr 6th, 2026 by Bruce Thompson
-
Is Non-Citizen Voting a Real Threat to Elections in Wisconsin?
Mar 18th, 2026 by Bruce Thompson
-
How Global Climate Change Affects Milwaukee
 Mar 11th, 2026 by Bruce Thompson


Wow those stats are a joke. a stats STUDENT could figure that one out.
Noah Williams’ garbage is what Republicans mean when they talk about “ideological diversity” on campus. And it’s why the Kochs and Bradleys and the W.W. Grainger foundation are looking for when they give big $ to a school.
But that doesn’t mean this dishonest, substandard work should be accepted by us in the reality-based community