Poll Analysis Shows How State Turned Red
Democrats had five percent edge in party identification in 2008 and 2012; that’s gone.

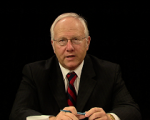
Charles Franklin. Photo courtesy of Marquette University.
Charles Franklin has been following Wisconsin politics since he joined UW-Madison’s Political Science Department in 1992. In 2013, Franklin moved to Marquette University’s Law School, where he teaches and directs its polling.
A past president of the Society of Political Methodology, Franklin said in a WisconsinEye interview last week that he will spend months trying to discern why the last pre-election MU Law School poll didn’t predict President-elect Donald Trump’s Wisconsin victory.
“We have plenty of Trump voters in our (polling) sample,” he noted.
Still, Franklin’s final poll had Hillary Clinton up 46 percent to 40 percent, and Trump won Wisconsin by a 48 percent to 47 percent margin. But most national pollsters also failed to predict Trump’s election.
Franklin was also asked a larger question: After looking at 224,208 poll responses over four years, what are the biggest changes in Wisconsin politics? He had some interesting observations.
–Party identification has changed. “ID in the 2016 electorate looked like party ID in the midterms – not recent presidential partisanship.”
Before the 2012 presidential vote, 37 percent of his poll respondents self-identified as Democrats and 32 percent said they were Republicans. That gap was also true before the 2008 vote: 39 percent said they were Democrats; 33 percent Republicans.
Before the Nov. 8 vote, however, the numbers of poll respondents self-identifying by party was a margin-of-error 1 percent: 35 percent Democrats, 34 percent Republicans.
Why is that significant?
“If that holds, it means Wisconsin is no longer a reliably Democratic state in presidential elections, and the mid-term and Presidential electorates no longer look very different,” Franklin said.
–There’s been a big drop in households with members belonging to unions. In 2012, about 22% of poll respondents said their household included a union member, but that number fell to 15.7% this year.
Thanks to Gov. Scott Walker’s Act 10, which eviscerated collective bargaining, the biggest drop came in households with someone in a government union: 10.4 percent in 2012, but only 6.1 percent this year.
Private-sector union households also fell – from 11.5 percent in 2012 to 9.5 percent this year.
Significance? Unions were much less able to help – with campaign cash and volunteers – Democratic candidates in 2012, 2014 and 2016 elections, Franklin said. That period included the failed attempt to recall Walker in June 2012.
–The Republicans’ eight-year lock on the executive and legislative branches is historic.
Between 1995 and 2010, one party controlled both the governor’s office and Legislature only twice, out of eight legislative sessions. That included Democratic Gov. Jim Doyle, and Democrats in charge of the Legislature, in the 2009-10 session.But the Nov. 8 election result means Republicans will control those two branches of government for eight straight years, from 2011 through 2018. “That’s quite a shift,” Franklin said.
The number of Republicans in the 99-member Assembly has grown the most, from 46 in 2009 to 64 next year.
Significance? “In terms of candidates who have laid out a set of policies that they are coherently running on, Republicans have had an advantage,” Franklin said. Democrats have struggled to pick their campaign issues, and “lay out their own platform.”
–Gov. Walker’s approval slump since 2014 is noteworthy.
In the October 2012 Law School poll, Walker was in the middle of his first term as chief executive, had passed Act 10 and survived a recall, and his approval rating was positive: 49 percent approved, 45 percent did not. His approval rating stayed positive overall – by four to five percent – in 2013, but dipped to +1.4 percent in 2014.
But, Franklin said, Walker’s approval rating then “cratered” – with those disapproved outnumbering those who approved by as much as 18.6 percent – in 2015, and stayed negative – although by smaller margins – this year.
That means, when Walker give his 2017-19 budget to legislators next year, Franklin said, the governor won’t be “as strong, in terms of public support.”
Franklin blamed a “double whammy” for the drop in Walker’s approval rating. One in three Republicans polled didn’t want Walker to run for President in 2015 – advice he ignored, Franklin noted. And, the 2015-17 budget Walker signed into law included some unpopular spending cuts.
But don’t ask Franklin who he voted for on Nov. 8. As a close and controversial follower of politics, Franklin has a personal policy of analyzing – and not helping elect – politicians.
Steven Walters is a senior producer for the nonprofit public affairs channel WisconsinEye. Contact him at stevenscwalters@gmail.com
The State of Politics
-
What Happened to Tax-Cut Negotiations?
 Apr 6th, 2026 by Steven Walters
-
Republicans Badly Divided in Final Senate Session
 Mar 30th, 2026 by Steven Walters
-
Why the Rise in Property Tax Anger?
Mar 16th, 2026 by Steven Walters


I wish Charles could explain why the richest suburb in Milwaukee County went to Hillary Clinton.