
Do Tax Cuts Lead to Economic Growth?
What the historic evidence since 1960s shows.

Hillary Clinton, Donald Trump and Paul Ryan.
Last week’s Data Wonk column looked at the tax proposals from Donald Trump, Paul Ryan, and Hillary Clinton. It looked at two questions: who would enjoy most of the benefits of these proposals and what effect did economic models project on the economy.
It turns out the Trump and Ryan proposals deliver most of their benefits to the wealthiest members of society, whereas Clinton’s are founded entirely by increased taxes on the wealthiest 20 percent and would result in small tax reductions on the remaining 80 percent. Two reputable models predicted that the Trump and Ryan proposals would have the effect of depressing the American economy by increasing the deficit.
Organizations supporting the Ryan, Trump, and similar plans will point out that their models predict that reducing taxes—particularly the top marginal rates as do these plans—leads to higher economic activity. What does the evidence say?
Milton Friedman, in his influential essay, The Methodology of Positive Economics, expanding on an earlier discussion by John Maynard Keynes, explained the connection between theory and evidence:
Viewed as a body of substantive hypotheses, theory is to be judged by its predictive power for the class of phenomena which it is intended to “explain.” Only factual evidence can show whether it is “right” or “wrong” or, better, tentatively “accepted” as valid or “rejected.” …the only relevant test of the validity of a hypothesis is comparison of its predictions with experience.
If the theory underlying the Trump and Ryan plan is valid, we should see increased economic activity following a reduction in the top marginal rate and decreased activity when the rate is increased. As a measure of economic activity here are the number of private sector jobs (in thousands) since 1940. The gray bars indicate recessions. Note that the general trend has been upward, but interrupted by the recessions.

All Employees: Total Private Industries
To explore whether tax policy has an effect of job growth, consider the next graph. It shows the growth of jobs over each presidential term since 1960. I have combined the Kennedy and Johnson terms, as well as the Nixon and Ford presidencies. The four earliest presidencies are shown with dotted lines; the four later ones with solid lines.
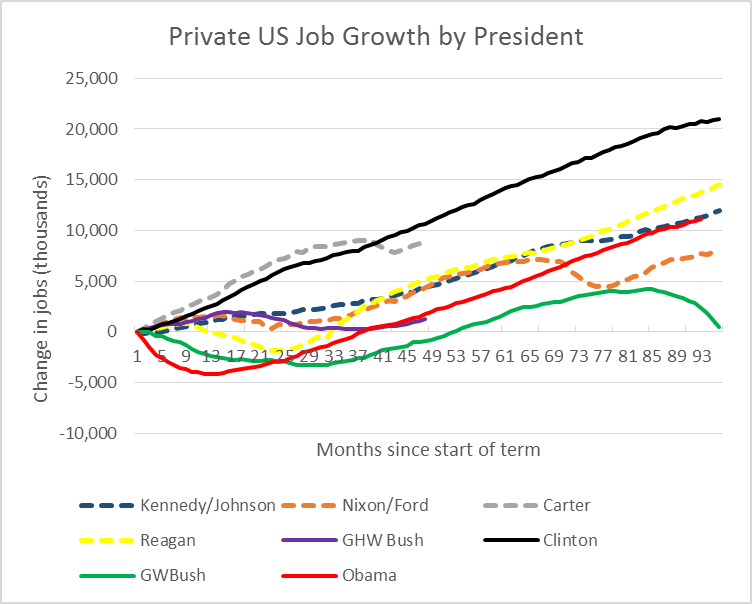
Private US Job Growth by President
Measured by the increase in the number of jobs over their terms, the two most successful job creators were Bill Clinton and, surprisingly, Carter. In the middle are three presidencies: Reagan, Kennedy/Johnson, and Obama. Once the Great Recession ended, jobs were added at a higher rate in the Obama administration than either the Kennedy/Johnson tenure or Reagan’s. These are followed by the Nixon/Ford and the first Bush administrations, which managed to include a recession or two but still ended up with a job increase. Finally, there is the Bush II administration, with a net job decrease.
How the data are analyzed can have a big effect on how they look. Using the same job numbers as before, the next chart has two changes. First, rather than starting when a president came into office and ending when he left, I associated each president with his longest growth period, starting when jobs started growing and ending when they shrank. The second change was to use the percentage increase in jobs rather than the absolute number. The second change had the effect of shrinking growth under later presidents because they were starting with a larger workforce.
I then assigned each job growth period to the president who was in office for most of that period. The first president Bush disappears from this chart; the early part of his term is treated as the end of the Reagan growth period while the later part is the early stage of the Clinton job growth.
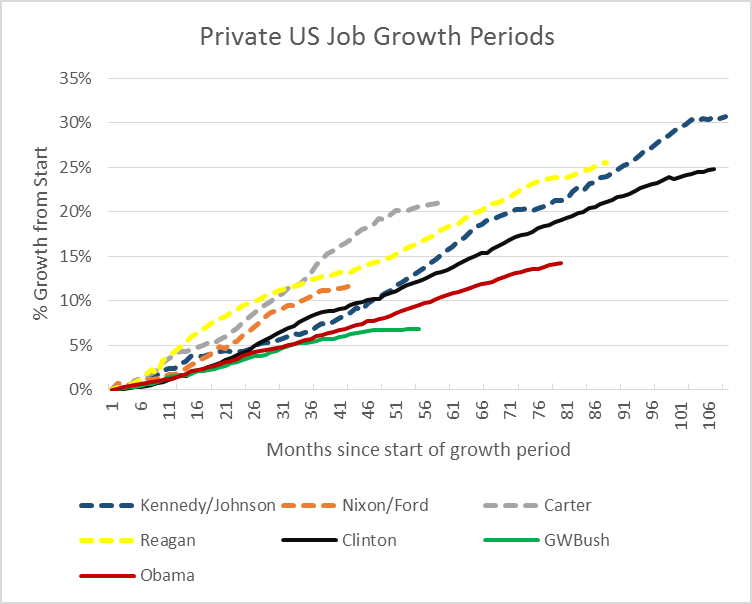
Private US Job Growth Periods
With these changes, Reagan moves up and Obama moves down. Carter’s job record is still surprisingly strong.
The next chart (just below) shows what happened to the top marginal tax rate (shown in red) during this period. As can be seen it has dropped substantially, from around 90 percent in the early 1960s, to as low as the high twenties, before moving back up to just under 40 percent. Along with the shrinkage of the top marginal rate, the number of tax brackets (shown in blue) also shrank.
Before getting into some of the historic details, it is worth noting that if there were a strong relation between marginal tax rates and prosperity, we would expect a noticeable jump in economic activity after the precipitous drop in the top tax rate in the 1980s. Instead there have been prosperity and recession both when tax rates were high and when they were low.
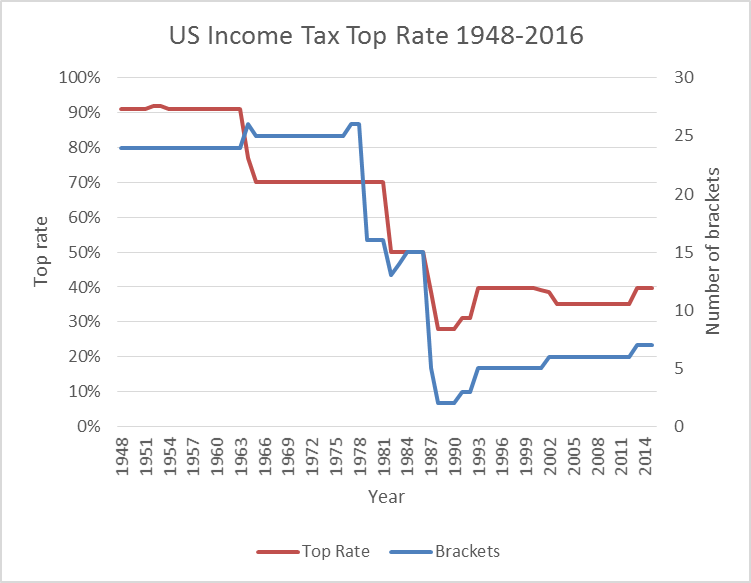
US Income Tax Top Rate 1948-2016
The first major drop in marginal tax rates, from 90 percent to 70 percent came during the Kennedy/Johnson administration and was followed by a long period of growth. Proponents of further reductions pointed to this as proof that tax reductions worked. They didn’t mention that the strong growth started before taxes were reduced.
The next major reduction in marginal rates came during the Reagan administration, from 50 percent to 28 percent. Proponents of low top marginal rate attributed the subsequent prosperity to the tax recovery rather than, say, recovery from the recession that dominated the first two years of Reagan’s term.
Whatever their effect on economic activity, the Reagan tax reductions led to growing deficits. In reaction, taxes were raised late in the first Bush administration and again early in the Clinton administration. Marginal rates went from 28 percent to 39.4 percent, accompanied by widespread predictions of economic collapse. Instead the 1990s was a time of prosperity and one of the few times the federal government ran a surplus.
Sensing that the boom was winding down, George W. Bush proposed tax cuts, and the top marginal rate was reduced to 35 percent. Despite this, his term suffered the worst economic performance of any recent president and ended in the worst recession since the Great Depression.
During the Obama presidency, the top marginal rate was raised back to 39.4 percent. Despite this increase, the recovery has continue at a steady, if slow, pace.
What can one make of this record? First, that by being selective in the data they choose, advocates of both increasing and decreasing the top marginal tax rate can find support for their positions. Sometimes reducing marginal tax rates is followed by a strong economy and other times not. Sometimes an increase in marginal rates is followed by a strong economy. Probably the safest interpretation is that playing with marginal tax rates is likely to have a negligible effect on economic activity.
This conclusion is also supported by evidence from the states. The states which have probably received the most praise from advocates of prosperity through marginal tax rate reduction are Wisconsin and Kansas. As the next chart shows, Wisconsin’s job creation has been running behind the national rate and that of its neighbor Minnesota. Kansas has lost jobs since its extreme tax reductions.
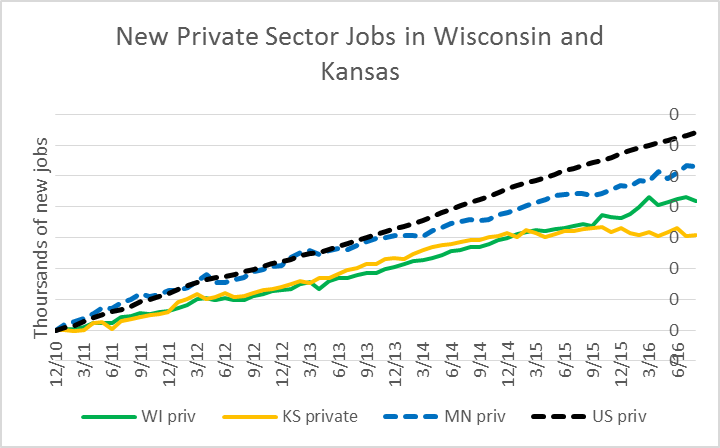
New Private Sector Jobs in Wisconsin, Kansas, Minnesota, and US.
In terms of percentage increases, the Obama recovery has been weaker than some previous recoveries. One possible factor is demographics. In 1960 the baby boomer generation was just starting to enter the work force. Today, they are reaching retirement age and qualifying for Social Security and Medicare.
In addition, in 1960 women made up only one-third of the workforce. Today they are close to half. Thus, that source of workforce growth could be scraping against its limit.
These two factors would lead one to expect the workforce would not be growing at the same rate as it did earlier. Based on OECD estimates of the number of Americans between 15 and 64, I calculate that this population has grown at about 0.6 percent per year recently, compared to 1.8 percent in the late 1970s. At some point the growth of the population will put a limit on growth in the number of jobs.Central to free market theory is the notion of consumer sovereignty — the consumer rules. The output mix is dictated by the tastes and preferences of the consumers. It is more accurate to call consumers the “job creators” than businesses. Businesses in the free market are responding to consumers and recessions result when consumers stop buying because they are worried about their future income.
Underlying both the Trump and Ryan tax proposals is a different theory. It posits that producers, not consumers, are sovereign. The unspoken assumption is that a weak economy is due to producers being unhappy about their taxes and regulations. If so, policy should be aimed at keeping producers happy so they won’t go on strike. That is what both Trump and Ryan propose to do.
But the historical data offers, at best, conflicting evidence to back up the theory that lower taxes on higher earners helps the economy. What we do know is the big tax cuts can cause big deficits, which can be a drag on the economy. That’s what reputable non-partisan experts have predicted about the Trump and Ryan plans.
Data Wonk
-
Who Do You Trust to Conduct Elections Fairly?
 Apr 6th, 2026 by Bruce Thompson
-
Is Non-Citizen Voting a Real Threat to Elections in Wisconsin?
Mar 18th, 2026 by Bruce Thompson
-
How Global Climate Change Affects Milwaukee
 Mar 11th, 2026 by Bruce Thompson


You hold up Minnesota as a model state for Wisconsin. This article is from the Minnesota Tribune by John Hinderaker. August 15, 2016 titled Minnesota, where the economy is not even average….. I site this: Perhaps most worrying is the fact that every year, thousands of households — on net — leave Minnesota for other states, overwhelmingly for lower-tax states. In 2014, the most recent year for which Internal Revenue Service data are available, those households took with them — again on a net basis, subtracting those who arrived from those who left — $980 million in income. The Census Bureau’s latest migration data, issued in March, indicates that the exodus from Minnesota accelerated in 2015.
John Hinderaker is a right-wing opinion columnist Jason. Hardly a respected economist. Is that the best you can do? Might want to find a credible source before you post next time.
PMD, lets turn Bruce’s story around and make it local. Does a $ 60 wheel tax increase on most adults in Milwaukee County lead to growth? Based on the word s and actions of local County politicians, I think not. Keep in mind this is a blue County that will probably vote for Hillary and Russ by a 2:1 margin and the public already finds it dead on arrival.
Keep in mind that you cited a conservative opinion columnist in a story about taxes and economic growth right after you mocked other people for not using credible experts.
What is the deal with the staff here showing pictures of Hillary Clinton from the year 2000. It didn’t seem hard to find the Trump spray on tan from 2016. I think the audience can handle pictures of Hillary in 2016.
So what? Jesus man get a new hobby. Your obsession isn’t healthy.
Jason, you’re a trove of deflections. Hillary’s picture? C’mon.
Left wants you to believe that higher taxes on businesses will bring more jobs, more regulations will do the same. Direction from DC, politicos will ensure that all businesses stay here, and expand rather then go into he world and trade.
Then even better the govt should nationalize all major businesses cause the same peoel who developed Obamacare, the USPO, the Vets admin will do much better than GE, GM, Ford, Walmart, Exxon.
Please keep Bruce’s columns coming. We need more winks and fewer rangers.
You don’t cut your way to growth WCD. Ask Kansas. Also,
“Mr. Trump and House Speaker Paul Ryan are united by the conviction that cutting taxes — especially on corporations and the wealthy — is what drives growth.
A look at the states, however, suggests that they’re wrong. Red states dominated by Republicans embrace cut and extract. Blue states dominated by Democrats do much more to maintain their investments in education, infrastructure, urban quality of life and human services — investments typically financed through more progressive state and local taxes. And despite what you may have heard, blue states are generally doing better.” http://www.nytimes.com/2016/07/31/opinion/campaign-stops/the-path-to-prosperity-is-blue.html
Thank you WCD for bringing up the FACT that Liberals will be closing down all businesses once they win on November 8th.
I hope you’re training a protege, THE WORLD NEEDS TO KNOW!!!
#Poe’sLaw
Is this a new conspiracy theory Tim?
No, it’s just those tricky LIBERALS keep changing the date, WCD has given me super-secret info that the LAME-stream media won’t report!
#Poe’sLaw
“Underlying both the Trump and Ryan tax proposals is a different theory. It posits that producers, not consumers, are sovereign. The unspoken assumption is that a weak economy is due to producers being unhappy about their taxes and regulations. If so, policy should be aimed at keeping producers happy so they won’t go on strike. That is what both Trump and Ryan propose to do.”…
Well THAT is the biggest mistake..Buying “Goods and Services” is 70% of the economy..
Tax cuts to the top work “inefficiently” at best. Tax cuts or “horrors” “money” to the lower economic groups is more efficient.
Cut FICA to ZERO and see the economy boom.
Ryan et. al. “trickle down” is proven garbage time and time again.
Lastly cutting on one end but “taking” from the other (i.e cutting “entitlements” ) is a zero sum game.
Fed “spends” and the private sector “collects” ( adds money into the economy) it is SIMPLE really.
Look up MMT AND heed Ron Pauls words:
“Congressman Ron Paul:
“Strictly speaking, it probably is not necessary for the federal government to tax anyone directly; it could simply print the money it needs………….”
And the axiom “it is not how much you “spend” but what you spend it on”..
money in the hands of the “takers” get spent, fueling the REAL economy..
SOOO many urban legends.. sooo little time.
https://mythfighter.com/
Of course not; it’s no more debate able than whether the Earth is flat or round.
PS: the fact that WCD insists that it’s flat is his problem.
I read so many comments on this site that make no sense no solutions just stupid, Frank, why bother.
Why bother is right. Don’t let the door hit you on your way out.
“I read so many comments on this site that make no sense no solutions just stupid’…
ONLY because you refuse to recognize facts:
Fact ONE:
Congressman Ron Paul:
“Strictly speaking, it probably is not necessary for the federal government to tax anyone directly; it could simply print the money it needs………..’
Fact TWO:
“… the government’s deficit results in surplus for the non-government (some of this surplus could be held by the foreign sector or even the Fed so we really shouldn’t say “government deficits equal private surpluses” or the accounting nerds will have our necks!). This is a net financial asset (NFA) because there is no private sector corresponding liability.
That’s all pretty obvious. What’s more confusing is the way some people use all of this to describe how the monetary system works. For instance, the sectoral balances equation can be broken down from the GDP equation where:
GDP = C + I + G + (X – M)…”
http://www.pragcap.com/yes-government-deficits-equal-private-surpluses/
After those 2 FACTS are digested, the rest boils down to ideology and psychology.
NOTE: This only applies to Fed “financing” not states, not business, not the Euro or any other non-sovereign money gov.and certainly not your checkbook..
Of course once you realize the Fed “uselessly” takes money from you well.. then many just get angry.. 😉
jeffseuss, I get it… you want to show off your new MMT learnin’… but how can you say that it will work the same when monetary policy is not pushing on a string, as is currently the case. However, it’s a little disingenous for me to bring that up because the economy has never been running so hot during my lifetime to make this a concern… yet, look at the outsize impact the 1970’s have made on the lizard-brained right wing boomers. Inflation is lurking around every corner!
“Inflation is lurking”.. In ones imagination..
BTW: “Some” inflation is good. Means there is more money in the economy..
Deflation is always more of a worry..and unemployment/under-employment.
One better than me to explain it:
http://bilbo.economicoutlook.net/blog/?p=10554
“Reagan proved deficits don’t matter”… D. Cheney..
They don’t even listen to their own.
Currently Fed’s “redistribution” is top heavy. Want to know why the economy is “sluggish”?
Where is the “little peoples” bailout?
Want to know why the data is “confusing”? Cut here raise here. Zero sum game.
Not “new learning”. Been doing this for years and have been AMAZED by how inflexible minds are..
People JUST don’t want to know the real facts..
Besides they make good “divide and conquer” messages.
Like Soc. Sec “going broke”.. not in the “real” Fed world of infinite DOD financing ect..
It is a matter of semantics NOT facts..
Only way soc sec “goes broke” is by the will of Congress..
Your ideas are spot on, I think a big obstacle to people agreeing or trusting those facts, is that they have some morality play assumptions about economics.
That if you work hard and are a good person, that you will somehow hit it big. Unfortunately, evidence hasn’t borne that out.
People look with mistrust at MMT (even if they don’t know what MMT is, the concepts are out there) because the perception is that there is no sacrifice for the positive outcome. In a way, it’s like people arguing against single-payer healthcare on the idea that (it must cost more, the outcomes are better!).