
The Shrinking Middle Class
National shrinkage of middle class households hits Milwaukee hard. Is there any solution?
Milwaukee
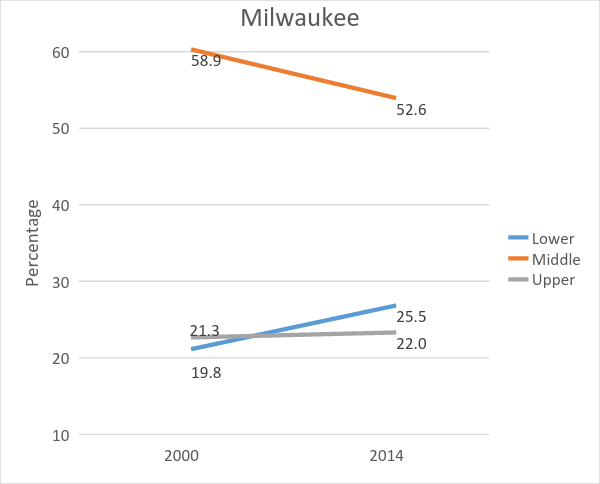
The latest Pew Research Center report shows that “the American middle class is losing ground in metropolitan areas across the country, affecting communities from Boston to Seattle and from Dallas to Milwaukee,” as its introduction notes. The graph to the right illustrates what has happened: in the four-county Milwaukee metropolitan area the middle class dropped from 58.9 percent of households in 2000 to 52.6 percent in 2014.
Milwaukee was not alone. For the U.S. as a whole, the middle income share of households fell from 55 percent to 51 percent. In fact, Milwaukee is very much in the middle of the trend, though the sentence I quoted above is the only mention of this city in the report’s text.
Pew defines the middle class as households whose income ranges between two thirds of the median household income to double the median income. Incomes are adjusted for household size and then scaled to reflect a three-person household. Adjustments are also made for the cost of living in a metropolitan area. They are also adjusted for inflation.
The Pew study confirms many other analyses showing increased income inequality over recent years. Strictly speaking, this report measures shrinkage of the percentage of middle income households, rather than of the middle class, although the two concepts are closely related.
In its analysis, Pew used data from two different government surveys. In some cases the boundaries of metropolitan areas changed between 2000 and 2014. This meant that the analysis could not be performed on every metropolitan area. In Wisconsin, the analysis included Milwaukee. Eau Claire, Janesville-Beloit, Racine, Sheboygan and Wausau. Other metropolitan areas, including Madison, Green Bay, and Appleton were not included because they were missing the needed consistency in data.
Although Milwaukee disappeared in the crowd, the other Wisconsin cities were singled out for one reason or another. Four of the ten cities with the largest proportion of middle income households were in Wisconsin. The top three in the U.S., in order, were Wausau, followed by Janesville, and Sheboygan. Eau Claire was also in the top ten. The news was not all good for these cities, however. Janesville-Beloit was noted as one of the cities hardest hit by the loss of manufacturing jobs. Wausau and Eau Claire also lost manufacturing jobs but other private sector jobs took their place.
Pew even singled out struggling Racine, as the city with the highest average pay for people in the middle class. The communities with the greatest economic loss over the time span were those where manufacturing played a greater role.

Income at 80th % to 20th vs % middle income
As I noted earlier, the Milwaukee metropolitan area generally fell in the middle in most measures. As the earlier graph showed, Milwaukee’s middle class is shrinking as both the lower and upper income households have grown, although more at the lower end than the upper. (I should, at this point, stress that the Milwaukee data covers the whole four-county area—Milwaukee, Ozaukee, Washington, and Waukesha—not just the city of Milwaukee.)
The report has a number of scatter plots, comparing how all the cities did on a pair of measures. Generally Milwaukee falls in the center. The graph to the right is typical. The horizontal axis shows the percentage of households that are classified as middle income. The vertical axis shows the ratio of income of households at the 80th percentile level to those at the 20th percentile, a measure of inequality.
Milwaukee is represented by the large red dot on the graph, in the middle both when it comes to the size of the middle class and when it comes to income inequality. The implication is that Milwaukee’s challenges are much more a symptom of national challenges than anything unique to this region.
The Pew report stops short of either suggesting the causes of increased income inequality or suggesting policies to counter it.
Among the causes is steadily increasing productivity in the private economy. This is one of the strengths of a market economy: competition creates an incentive for continuous improvement.
But growing productivity also creates winners and losers. Although economists like to talk about the theory of comparative advantage—that both sides benefit from trade—in practice many people just see disappearing jobs. They don’t have the luxury of stepping back and thinking that in the end greater productivity will lead to a higher standard of living.
Economists define private goods as ones that are “rival in consumption” and “excludable.” A bicycle, unless it is part of a bike-sharing program, is a private good. If a customer buys a bicycle that particular bicycle is not available to another customer— it’s a rival in consumption. So long as the bike shop owner locks his doors, a customer cannot own that bicycle without paying for it—excludable. Markets are able to efficiently supply private goods.
Public goods are defined as “nonrivalrous” and “nonexcludable” (there are also some with only one of these characteristics). While the bicycle is a private good, the bicycle trail is a public good. Unless it is operating close to capacity (try riding across the Brooklyn Bridge on a pleasant weekend), use by one bicyclist doesn’t infringe on use by others. Nor is it practical to build and operate toll booths at every entrance to a bike trail. Markets work poorly or not at all for the distribution of public goods.Can our present jobs problem be solved by expanding private sector demand—that is, through the market? Increasing income inequality makes that more difficult. Upper income people spend a smaller portion of their income on consumption. Low income people, those who would spend their whole income on consumption, don’t have the income to spend.
This also helps to explain our recent bubble problem—where prices rise not because of underlying values but in anticipation of continuing price rises. Recent periods of prosperity have turned out to be driven by bubbles—the dot.com bubble of the 1990s and the housing bubble ending in 2008. One possible cause is too much wealth for the rich with too few ways to invest it. Have we lost the ability to have non-bubble prosperity?
Economics is often described as the study of scarcity. At the risk of being branded a heretic, I would argue that the market has solved the scarcity problem when it comes to the kind of private goods that appear on the shelves of Walmart or the Amazon website. There is no scarcity of goods; the problem is not supply but a lack of purchasing power. If Walmart or Amazon detected a doubling of customer demand, they would double supply, not turn present customers away.
Despite the popular description of private business as the “job creators,” recent research has found that net job creation is concentrated in a subset of businesses—recent technology startups. Other businesses, on average, either aren’t growing or are concentrating on producing more with fewer employees.
Yet our society does have needs to which the surplus of both labor and wealth could be invested: we have a need to address our backlog of public goods, for better roads, bridges, parks and other infrastructure. Doing so, however, requires confronting the widespread superstition that only private sector jobs are real jobs.
The Production Possibility Frontier
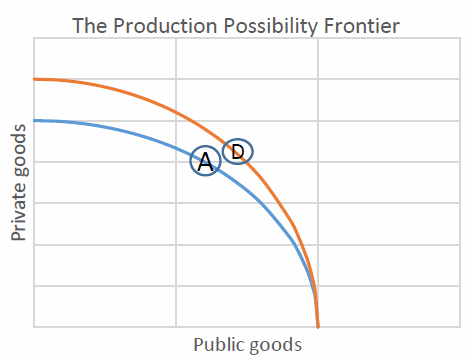
Early in introductory economics students are introduced to the concept of the production possibilities curve. It usually looks something like the graph to the right and represents the tradeoff between two goods. For instance, the axes might be labeled “wheat” and “corn.” If farmers plant more corn production of wheat goes down—and vice versa.
Rather than corn and wheat, I have applied the production possibilities frontier to public and private goods. We seem to be stuck at point A, which is very efficient at producing private goods. We could, however, produce more in total and move to point D by addressing our backlog of public goods. The problem is not the market, which has worked very well. We are failing at distributing public goods — and at a time when there is excess of labor and wealth that could both be invested in this. Our inability to address this opportunity represents a failure of imagination in public policy.
Data Wonk
-
Who Do You Trust to Conduct Elections Fairly?
 Apr 6th, 2026 by Bruce Thompson
-
Is Non-Citizen Voting a Real Threat to Elections in Wisconsin?
Mar 18th, 2026 by Bruce Thompson
-
How Global Climate Change Affects Milwaukee
 Mar 11th, 2026 by Bruce Thompson


Great analysis and commentary, Bruce. Thank you.
This article actually felt politically balanced. My only criticism is that we had a near trillion dollar stimulus in 2009, Democrats controlled all facets of the federal government. They promised that most stimulus would go to bridges, railroads and other “shovel ready jobs”. Instead we saw, political high fives. Teachers were showered with educational classes, solar panel factories like Solera, were given goodies and then went bankrupt. A lot of states were given money to operate trains and trolleys for public transportation as citizen flocked to more modern transportation like Uber and Lyft. Shall we play this game again when Democrats promise infrastructure and then again grease their political friends.