Both Sides Wrong About Walker’s Impact on Jobs
Actually, the data shows Gov. Walker has had little impact, positive or negative, on how the state grows jobs.
Both Scott Walker and his challenger Mary Burke have released their jobs plans for Wisconsin. While they don’t agree on much, they do agree on one thing: that the Wisconsin jobs trajectory radically changed in January 2011 when Walker took office.
Walker’s plan is particularly obsessed with drawing a sharp contrast with his predecessor. It mentions Doyle by name 33 times, more even than his challenger (29 mentions of Burke). By contrast, the Burke plan mentions Walker three times.
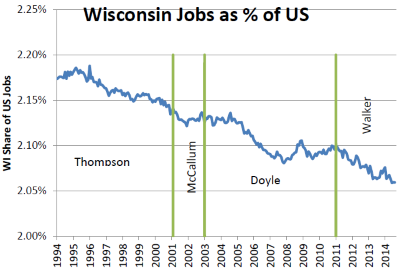
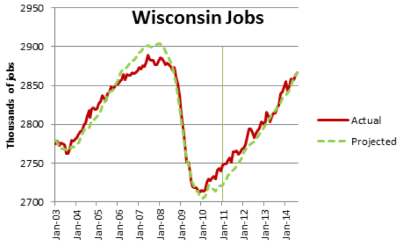
Over the past 20 years, the ups and downs of Wisconsin employment reflect those of the national economy. As the first chart here shows, the biggest influence on Wisconsin jobs is what happens to jobs nationally. When US employment grows, so does Wisconsin’s, but at a lower rate. When US employment shrinks, Wisconsin employment shrinks but usually more slowly.
When Doyle was inaugurated, Wisconsin had 2.13 percent of US jobs; today it has 2.06 percent. This may not seem like a big difference, but the steady, long-term decline in the proportion can have a major effect when job growth is measured.
This ratio was then multiplied by the US jobs numbers to predict Wisconsin jobs over the course of the Doyle and Walker administrations. The red solid line shows actual jobs, while the green dotted line shows those predicted by the model. As can be seen, this model does a remarkably accurate job of predicting most Wisconsin job numbers over the past 12 years. In any month the model is within 10,000 jobs (over or under) of predicting the total number of Wisconsin jobs (which have ranged between about 2.7 million and 2.9 million).
There are two periods in which the model’s predictions diverge from the actual job numbers: the period immediately before the economic crash of 2008 and immediately after it bottomed out. The first was also the period of the bubble in housing prices and “irrational exuberance” in the financial sector. Wisconsin’s housing bubble was smaller than nationally and its financial sector is relatively small, likely explaining much of the difference.
Likewise, the second divergence can also be laid at the feet of Wisconsin’s smaller bubble. If fewer houses were under water in Wisconsin than nationally, the recovery would be easier.
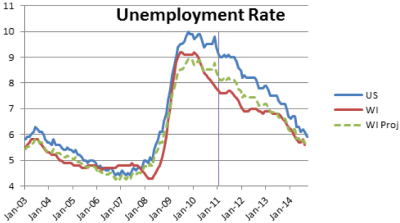
A second number relevant to the jobs number is the unemployment rate. The second graph here shows the US and Wisconsin unemployment rates over the same time period. First, regression was used to calculate the relationship between the Wisconsin and US unemployment rates using numbers from the Doyle years. The resulting relationship was then applied over the entire 12-year period. Again, the results support the hypothesis that the most important determinant of the Wisconsin economy is the national economy. On average, the actual and predicted rates differ by less than 0.3 points.
Although this model does a pretty good job overall of predicting the unemployment rate, it underestimates the rate before the crash and over-estimates it by the end of the Doyle years. Again, it seems likely that the lower housing bubble is largely responsible.
As the Walker jobs plan is happy to point out, the one period where Wisconsin’s rate exceeded the national rate roughly corresponded to Burke’s term as Commerce Secretary. The unspoken assumption is that there is something she did to cause this effect, but cause and effect has never been explained. Again, the more likely causes are the housing and financial bubbles which probably caused national unemployment to drop more than Wisconsin’s.
The reasons behind Wisconsin lower peak rate of unemployment after the crash are unclear. Perhaps they reflect differences in Wisconsin’s work force and industrial mix. If Wisconsin employers believed skills were hard to replace, they might be more reluctant to lay off workers.
Whatever the reason, Doyle bequeathed to Walker an unemployment rate well under the national average. While still below the national rate, the gap has since been narrowing.
To understand the failure of Walker’s promise, then, one must look to what was happening in Washington rather than Madison. If the US Congress had decided to follow a policy of economic stimulation, instead of austerity, it seems likely that Walker’s promise would have been fulfilled.
There are numerous differences between policies pursued by the Doyle and Walker administrations, and presumably by the Burke administration if she is elected. It is ironic, then, that models using data from the Doyle years comes so close to predicting job growth and unemployment in the Walker years. From a jobs standpoint, the Walker administration simply looks like an extension of the Doyle administration. This can’t make partisans of either party happy.
Data Wonk
-
Life Expectancy in Wisconsin vs. Other States
 Dec 10th, 2025 by Bruce Thompson
-
How Republicans Opened the Door To Redistricting
 Nov 26th, 2025 by Bruce Thompson
-
The Connection Between Life Expectancy, Poverty and Partisanship
 Nov 21st, 2025 by Bruce Thompson




This is often a point that I make in real discussions on job and employment growth in WI and the country.. the government has far less control over the economy than politicians like to pretend they do. I think the biggest influence they have is generally psychological. I think it was Walkers belief and his plan was to project a business friendly climate in our state in order to help bolster business growth based on those psychological factors. Like you said BT, the 250k wasn’t unattainable, (although why you’d say it would be attainable at US population growth instead of comparing it to WI population growth is concerning). Even if he hit 200k, Walker probably assumed it’d look pretty good.
The other thing I noticed… WI jobs as a percent of US jobs went down .03 or so percent during Walkers term and, maybe not coincidentally the population of WI as a percent of the US went down about the same. This would further back your position on Walker not having as much control of job growth as he’d like to portray.
The only problem I really have here is the seemingly random statement in the second to last paragraph that seems to, without any correlation to the topic at hand, purport that congress should have followed a path of economic stimulation instead of austerity. There is absolutely nothing tying this idea into the rest of the article. It’s also confusing because, under Obama, our country saw record spending and huge stimulus bills passed by congress. Obama, even without the great spending of the Iraq/Afghan wars seen under Bush, still spent what, three quarters of a trillion dollars more per year? So this statement is not only off topic, but unsubstantiated in it’s claims.
Otherwise thanks for some insightful stuff!
Sorry Andy, (and this is certainly off topic) the Obama administration and QE whatever was an asset swap not “stimulus”.. You know the old saying “it’s not how much you spend but what you spend it on”. well the Fed “spent” poorly.
Bruce was 100% correct in the “stimulus vs austerity” thing..
EK: And part of the argument here is that the channels by which fiscal policy operates are more straightforward than the channels by which quantitative easing operates, right? If the Fed buys long-term Treasury bonds, other things need to happen before anyone gets a job. If the government decides to build a bridge, people who build bridges, and people associated with the building of bridges, get jobs.
JS: Right. We know from the historical experience that unemployment benefits get spent almost dollar-for-dollar, and infrastructure spending actually gets spent, and you get new assets to boot.
http://voices.washingtonpost.com/ezra-klein/2010/10/stiglitz_we_need_more_stimulus.html
Soo many urban legends.. soo little time.
Jeff, I was not referring to quantitative easing… I was only speaking to actual outlays as spent by the federal government.
The article points out that Wisconsin’s job share is shrinking over time (from as much as 2.19% of all US jobs in 1996 to about 2.06% today).
But in recent decades, Wisconsin’s population share has been shrinking as well. (In the 1990 Census, Wisconsin had 1.97% of the US population; in 2000, 1.91%; and in 2010, 1.84%.)
So, the question is, does the job shrinkage have more to do with population share reduction or with state fiscal and tax policy?
Good comments here. Thanks.
Andy,
If one accepts my model that Wisconsin jobs grow and shrink as a (declining) percentage of US jobs, it is hard to restrict the discussion to Wisconsin. If US jobs had grown at the same rate as the population, and Wisconsin followed its historical pattern, the 250,000 goal would have been met.
This brings up the question of why US job growth has been so anemic (which deserves a whole separate article). Other than the first stimulus package, the US has been largely following a policy of austerity. The argument here is that QE is forced on the Federal Reserve because fiscal policy has been contractionary.
Andy and Tom D,
You make a good point about the question of jobs versus population. I don’t think we want to make Milwaukee into Atlanta or Dallas. We do want an environment where people can find good jobs and don’t feel impelled to leave. None of the measures completely capture the distinction.