
Are Democrats Better for the Economy?
The data shows Democratic presidents have better economic growth. But is the data meaningful?
The loudest portion of the Democratic base in Wisconsin betrays an underlying hostility to business and the market economy. Yet historically business has performed best when Democrats inhabit the White House. This is counter-intuitive since the Republican Party is considered the party of business. In Wisconsin most business political contributions go to Republicans.

Click chart to enlarge.
In the chart to the right I track the percentage change in the stock market over four-year presidential terms between 1928 and the present (two and a half years for Obama’s second term). On average, the Dow Jones under Democratic presidents increased by 53 percent compared to 15 percent for Republicans.
Recently Princeton economists Alan Blinder and Mark Watson looked at economic performance over the post-war period. In Presidents and the Economy: A Forensic Investigation they conclude that, “…the U.S. economy performs much better when a Democrat is president than when a Republican is.” Blinder and Watson looked at a number of measures, including:
Click chart to enlarge.
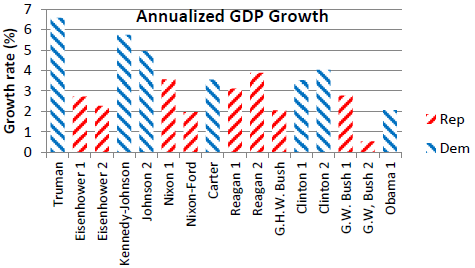
- Gross Domestic Product: “It is clear at a glance that GDP growth rises when Democrats get elected and falls when Republicans do.” The chart to the right shows their calculation of the yearly growth over each four-year term for the post-war period.
- Recessions: “Over the 256 quarters in these 16 terms, Republicans occupied the White House for 144 quarters, Democrats for only 112. But of the 49 quarters classified by the NBER as in recession, only eight came under Democrats versus 41 under Republicans.”
- Income inequality: “…income inequality rises under Republicans but falls under Democrats.”
- There was a statistically significant Democratic advantage in other areas including payroll, employment, employee hours, change in the unemployment rate, growth rates in most major components of GDP, and corporate profits.
In their introduction, Blinder and Watkins summarize their findings:
The superiority of economic performance under Democrats rather than Republicans is nearly ubiquitous; it holds almost regardless of how you define success. By many measures, the performance gap is startlingly large–so large, in fact, that it strains credulity, given how little influence over the economy most economists (or the Constitution, for that matter) assign to the President of the United States.
One reason for skepticism about such results is that there are numerous examples of people identifying historical patterns that seem to predict future events, such as which stocks will rise in price, or who will win the World Series or the next election. Most such patterns lose their predictive power as soon as they are identified. (One of the more bizarre examples of this fallacy appeared just days before the 2012 election. A posting at the conservative Brietbart site argued that Romney would win because “Republicans have won every November 6th presidential election since 1860.” Needless to say that pattern didn’t hold.)
The reason that such patterns disappear on discovery is that the apparent relationship is fallacious. The mere existence of a pattern does not prove causality.
The Blinder and Watkins’ results are not a new discovery, nor is my analysis of stock prices. Numerous articles have been published, both scholarly and popular, discussing the partisan stock market phenomenon starting in the 1980s. The Blinder and Watkins study is only the latest in a long series finding a similar pattern. Rather than going away after being discovered, the relationship between the strength of the economy and the party of the President has grown stronger in recent years.
Critics of these results have tried a number of ways to make them disappear. One approach is to question the starting point. When does a new president’s influence start and that of his predecessor stop? For the stock market calculations, I used inauguration day as the divide. This choice is somewhat arbitrary. Since people buy and sell stocks based on anticipation about future prices, it could be argued that the transition comes at an earlier date–Election Day perhaps. Or perhaps the new president’s influence kicks in later as economic policies become clear. Practically speaking, a difference of a few months in either direction has little effect on the results.Another tack taken by critics is that instead of presidents influencing the economy, the state of the economy influences who is elected. In this view, Democrats win when times are bad, so the stock market can only go up as the economy recovers, and Republicans are elected when everything seems rosy, so it can only worsen. But models developed by political scientists to predict election outcomes show that incumbents of either party are hurt by a bad economy.
Perhaps eager to show that they are not partisan, Blinder and Watkins struggle mightily to show that the phenomena they identify aren’t real:
We examine possible economic mechanisms that might explain the partisan growth gap, including factors that might be construed as “just good luck” and factors that might be interpreted as superior economic policy. We find that oil shocks, productivity shocks, and shocks to consumer expectations about the future each help explain the growth gap. At least the first two of these look a lot more like good luck than good policy.
Blinder and Watkins also look at economic policy and find it doesn’t do much to explain the difference:
Fiscal policy reactions seem close to “even” across the two parties, and monetary policy is, if anything, more pro-growth when a Republican is president—even though Federal Reserve chairmen appointed by Democrats outperform Federal Reserve chairmen appointed by Republicans.
They conclude that these “luck” factors explain only about half the difference:
These three “luck” factors together (oil, productivity, and ICE [a measure of consumer confidence]) explain 46-62% of the 1.80 percentage point D-R growth gap. The rest remains, for now, a mystery of the still mostly-unexplored continent. The word “research,” taken literally, means search again. We invite other researchers to do so.
Matthew Yglesias argued that even some of the things described as good luck could also be considered the result of better policy:
Democrats do a better job of managing foreign affairs, of instilling confidence that government is on the side of the middle class, and of promulgating federal regulations in the public interest.
These results should of course be treated with caution. The sample sizes are small—around twenty if each four year term is treated as a separate unit, more if smaller time units are used. The trouble with using historical data is that it is not possible to rewind history, change only the election results, and see if it comes out the same.
Even so, statistics can help us estimate how confident we should be in the results. Statistical calculations of differences are usually accompanied by what is called a “p-value.” The p-value is an estimate of the likelihood that the difference resulted from pure chance. As mentioned earlier, stock prices increased by 53 percent under Democratic presidents compared to 15 percent under Republicans. The p-value in this case was between 8 percent and 9 percent. In other words, the likelihood that a difference between Republicans and Democrats resulted from random variation is less than 10 percent.
One question that comes up after studies of this nature are issued is why the president’s party identification should have so much influence. Certainly administrations of each party have differed from the other in consistent ways. Democratic presidents have been more supportive of measures that make the combination of revenues and expenditures more progressive, by means of the minimum wage, the tax code, and various programs targeting low-income people. Obamacare, for example, contains a number of provisions that have a redistributional effect, including a tax surcharge on high incomes, expansion of Medicaid, and tax credits tied to income.
By contrast, Republican administrations have been much more supportive of measures that redistribute income upwards, such as the Bush tax cuts or proposals to cut unemployment benefits or reduce food stamps. Particularly in recent years they have been devotees of “supply side” economic policies that advocate reducing the top tax rate. This philosophical difference is reflected at the state level, as in Walker’s push to reduce the state income tax, the most progressive of Wisconsin’s three major taxes.A related question is why attempts to relate partisan control in Congress to economic outcomes have proven futile. Part of the answer may relate to the difference in the institutions. Presidents preside over the largest part of the government, appointing department heads and nominating members of independent bodies such as the Federal Reserve. Congress, by contrast, generally plays a more reactive role, lacking a single point person. Thus to the extent that the government has any strategy at all, that strategy is most likely to reflect the president’s goals.
A second part of the answer is that even if the partisan balance in Congress was as important as the president’s, the effect would be harder to measure. As a start, the number of variables needed doubles to include who controls both the House and the Senate. Next, the composition of the two Congressional delegations of today is quite different from of the 1930s and 1940s with the migration of southern conservative whites from Democratic to GOP. Historical data from before this transition may have little relationship to what happened since. Between the doubling of variables and the change in the Congressional delegations, a partisan economic effect, even if it exists, would be difficult to detect.
Blinder and Watkins comment on “how little influence over the economy most economists assign to the President of the United States.” Like the insistence by the Journal-Sentinel’s editorial board that Wisconsin’s state policies have little effect on the economy, this belief seems much more based on faith than evidence. In the case of the president’s influence on the economy, one can view the studies as evidence that the null hypothesis — that there is no difference — should be rejected.
My next column will look at possible explanations for the difference.
1
Data Wonk
-
Who Do You Trust to Conduct Elections Fairly?
 Apr 6th, 2026 by Bruce Thompson
-
Is Non-Citizen Voting a Real Threat to Elections in Wisconsin?
Mar 18th, 2026 by Bruce Thompson
-
How Global Climate Change Affects Milwaukee
 Mar 11th, 2026 by Bruce Thompson


A most fascinating point they also make shows the performance of the economy during particular years of the presidency. Where the economy tends to grow more towards the beginning of a democrats tenure (after taking over for a GOP president), the republican presidents tend to see an economic growth rate expand towards the end of their term… meaning the GOP presidents tend to see momentum build through their presidency while the democrat presidents seem to lose momentum. Although, as they admit, that makes an already small sample size even smaller.
Also, we need to go ahead and recognize Roosevelt’s first term as an outlier when looking at the stock market pricing. I’m pretty sure it’s a major outlier… BT, can you run the numbers to see if it indeed is a statistical major outlier? That has a pretty profound effect on the results.
Is this the kind of thing where partisans can cherry pick data to bolster their arguments? It feels that way, but I’m not an economist.
Yes. But that’s what economics is all about! Kinda fun actually…
Andy,
On your outlier question, if we use the common rule that outliers are anything over 3 standard deviations away from the mean, then the percentage growth in Roosevelt’s first term would be an outlier. However, there is a basic asymmetry to the way I calculated the percentage changes by dividing by the starting value–an increase gives a larger percent change than the same decrease. If that upward bias is removed by averaging the starting and ending points, Hoover is an outlier rather than Roosevelt. But limiting the study period to post war, as B and W do, doesn’t seem to affect the results much.
On your first point, I recall reading an article that made that argument. At the time it struck me as overfitting the data. As I recall, it was written about 10-20 years ago. An important test of any model is how well it predicts the future. Although the pattern described might fit the Clinton administration, it does not seem to describe what happened under either of his successors.
Bruce
The numbers just aren’t even remotely close by any measure. For example: GDP growth by party, unemployment by president and stock market performance by party.