The Real Impact of the Minimum Wage
A new study by the nonpartisan Congressional Budget Office looks at the costs and benefits.
The recent Congressional Budget Office report on the minimum wage has been seized upon by some opponents of raising the minimum wage. It is important therefore to look at what the report actually says. First, it’s worth noting the CBO is careful not to take sides on issues since both parties depend on its estimates. Thus it tends to adopt conservative assumptions about what is likely to happen.
The CBO looked at two options. The first would raise the federal minimum wage from $7.25 to $10.10 an hour in three steps. This would give the minimum wage almost the buying power it had in 1968. The second option would raise it to $9.00 in two steps.
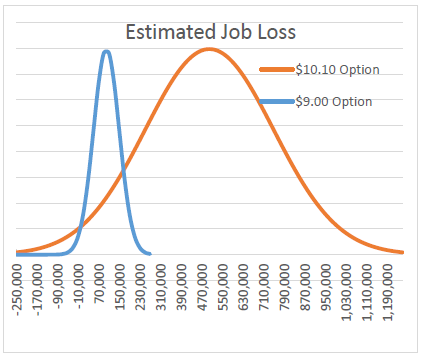 The center point of the CBO estimate for the first option is a loss of 500,000 jobs with a range of estimates running from a small gain to a loss of about a million jobs, as sketched in the first graph.
For the second option, raising the minimum wage to $9, the midpoint of estimates was a loss of 100,000 jobs.
While the 500,000 number may seem large, it’s less than 1 percent of US unemployment. It represents about two months of average job gains in 2014.
The potential job loss must also be balanced by the resulting reduction in poverty. The CBO estimated the $10.10 minimum wage would reduce the number in poverty by 900,000. With the $9 wage the poverty reduction was smaller but still substantial: 300,000 people crossing the poverty line.
16.5 million workers making less than $10.10 per hour would get a wage increase under the first option. Under the second option, that number drops to 7.6 million.
The CBO also estimated the total change in real net income for four groups of families: those currently below the poverty threshold, those whose income is between one and three times the poverty threshold, those between three and six times the threshold, and those over six times the poverty threshold. These estimates are shown in the next graph.
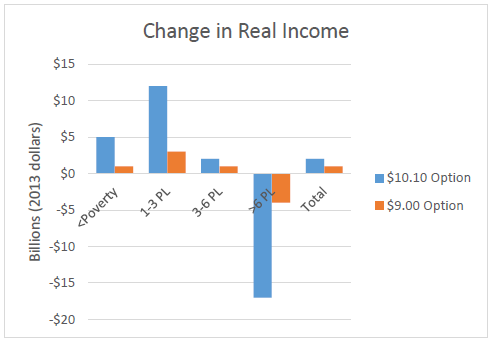 Three of the four groups would have an increase in total net income. Only the groups with the highest incomes would have a net decrease, reflecting a rise in prices of some goods and services people purchase.
Thus an increase in the minimum wage has a re-distributional effect from higher income families to those with less. Therefore it somewhat counteracts the redistributional effect of the prevailing tax scheme in Wisconsin and elsewhere.
This redistribution from top to bottom is reflected in the CBO’s calculation that when the income changes across the spectrum are added together there is a net gain to all families of $2 billion. This reflects the increased economic activity that results when low-income people see their income increase.
The CBO estimates are well within empirical studies of the effect of the minimum wage on employment. As I discussed in a previous article, some studies found a decrease and some an increase in employment but all the effects were small. A brief look at economic theory helps explain why the change could go either way. The next graph shows the classic chart of supply and demand for businesses that both hire minimum wage workers and sell to them. Fast food restaurants like McDonalds and low-price retailers like Walmart are examples.
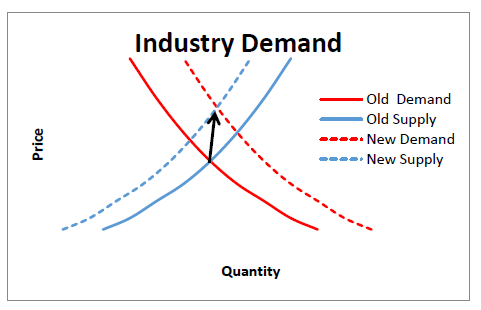 A rise in the minimum wage pushes the supply curve to the left as the business faces higher labor costs. At the same time, the demand curve moves right because customers have more income. The new equilibrium will settle at a higher price than the old, but the quantity sold—and therefore the need for employees—could shift in either direction, depending on the specifics of the situation.
How much are prices likely to rise if the minimum wage is increased? A recent op ed in the Journal Sentinel raised the specter of a $10 Big Mac. Is that realistic? Let’s say the current price of a Big Mac is about $4. An estimate from a consulting firm serving clients interested in buying a franchise estimates that the cost of crew labor (including the payroll tax) represents about 22 percent of revenue for the typical McDonalds franchisee. Assuming that all crew members would get a wage increase and applying these factors suggests the $4 Big Mac might be priced at $4.34.
The CBO report debunks several widespread myths about low-wage workers—those making less than $10.50 an hour. One is that they are mostly teen-agers earning gas and date money; CBO found that 12 percent were under 20. Another is that they are mostly high school students or dropouts; 21 percent had not graduated from high school. It also found that a majority worked full-time.
In last fall’s elections, voters in Alaska, Arkansas, Nebraska and South Dakota passed proposals to raise the minimum wage, bringing to 29 the number of states with minimum wages higher than the federal level. As a result, Wisconsin is now in the minority of states whose minimum wage is effectively the federal wage.
When the University of Chicago asked its panel of academic economists whether or not raising the minimum wage would “make it noticeably harder for low-skilled workers to find employment,” the response was evenly split, but no one expressed strong confidence in their answer. But when asked whether doing so was a desirable policy only 12 percent said no. Taking all the CBO findings together helps explain why there is a growing consensus about the desirability of raising the minimum wage.
Data Wonk
-
Why Absentee Ballot Drop Boxes Are Now Legal
 Jul 17th, 2024 by Bruce Thompson
-
The Imperial Legislature Is Shot Down
 Jul 10th, 2024 by Bruce Thompson
-
Counting the Lies By Trump
 Jul 3rd, 2024 by Bruce Thompson


BT, do you think the quick spike of the minimum wage in 1968, which put it at more than twice what the minimum wage was designed to be at it’s inception in 1938, played any role in the rising unemployment in the immediate years after and do you think it played a hand at all in the stagflation of the 70’s?
The 1968 minimum wage “spike” was only 14%—from $1.40 to $1.60.
The economy back then was greatly affected by the Vietnam war. Lyndon Johnson pursued a “guns and butter” agenda—greatly increasing military spending without asking civilians for any financial sacrifice. This led to inflation and low unemployment rates. (There were 500,000 US soldiers in Vietnam, alone.)
That changed starting in late 1969 when Nixon started pulling soldiers out of Vietnam and scaling back the war.
And then, on August 15, 1971, Richard Nixon fundamentally changed the economy three ways:
• He imposed wage and price controls (which came off later)
• He took the US off the gold standard
• He imposed a new 10% duty on all imports
Collectively these actions are called “Nixon Shock”. (Google it.)
What happened to unemployment and inflation rates after 8/15/71 had far more to do with Nixon shock (and the wind down in Vietnam) than with a minor 1968 increase to the minimum wage.
Another thing that affected unemployment rates back then was the draft. Almost every male between age 18 and 26 had to serve at least 2 years, and tens of thousands of them were coming home in body bags. I lived through those days (with a draft-ready 1-A status) and it was terrifying.
Many people went to college just to avoid the draft. (If you were pursuing a bachelor’s degree, you were exempt from the draft for up to 4 years.) When the first draft lottery was held in 1969, almost a million young men learned for the first time that they were very unlikely to be called, and I’m sure some dropped out of college for that reason. When the draft ended in 1973, more men dropped out of college.
And even if you weren’t in college, having a draft-ready status made you less employable. Back then, job résumés for men routinely included your draft status along with your address and phone number, because it was one of the first things an employer asked about. If you were subject to be called, you were much less likely to be offered a good job. Once the lottery happened (and, later, the total end of conscription), many men (including me) were suddenly able to pursue much better jobs.
This influx of college-age men into the work force (together with the Baby Boomer generation coming of age and looking for work) also probably had more to do with unemployment than the 1968 minimum wage increase.
Bruce, it is not necessary to write tham much about min wages. they ahve no proved to be inflationary. the chocie is simple. CBO has shown tht about 50% of the peopel that we help will lose jobs or never get them. IN Milwaukee we ahve 57% youth unemployment. what are we goign to do with thes kids.
My proposal for years has been to create a trianign wage of $5 for on year as ak businesses to hire youth, under 24 to do various jobs and then guage their work to see if they want to keep them. It costs the compnay a fair amount to train epopel so may be we can get peopel to hire someof thes ekids, tain them and get htem to ork. they lear repsosnbility, to get heir on times, to work hard. it will nto be big asset to busonesses caus most of them cannot do much but it might help.
Tom D, thanks for the write up. It was well written and very informative for people not familiar with the context.
However my question has to do with how the spike in minimum wage, which was almost 30% if you go back even 2 years instead of one, affected unemployment and inflation given the events and decisions at the time. Sorry if I wasn’t clear, I ask that question in the context of the time.
AG, Back to your original question, I plotted the real minimum wage on the same time scale as the annual percentage change in jobs since 1947. I can’t discern any pattern. I also did a multiple regression between the change in jobs (dependent variable) and the changes in the minimum wage over the previous 6 years. None of the tests were statistically significant. There is just way too much noise in the economy to make this a viable approach to estimating the minimum wage effect on employment.
I just took the CBO estimates.