
New Marquette Law School Poll national survey finds approval of U.S. Supreme Court edges upward, but 55% disapprove of the Court’s work
Large majorities of both Republicans and Democrats favor strict ethics code, fixed terms for justices; majority of those polled say justices decide cases based more on politics than law
MILWAUKEE – A new Marquette Law School Poll national survey finds that 45% of adults approve of the job the U.S. Supreme Court is doing, while 55% disapprove. In July, approval was 43% and disapproval was 57%.
The trend in approval since 2020 is shown in Figure 1 and Table 1. (All results in the tables are stated as percentages.)
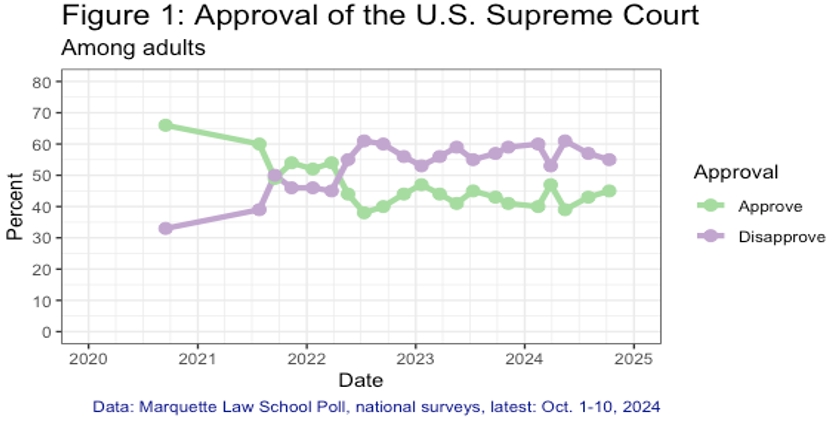
Graph from Marquette University.
Table 1: U.S. Supreme Court approval
Among adults
| Poll dates | Approval | |
| Approve | Disapprove | |
| 10/1-10/24 | 45 | 55 |
| 7/24-8/1/24 | 43 | 57 |
| 5/6-15/24 | 39 | 61 |
| 3/18-28/24 | 47 | 53 |
| 2/5-15/24 | 40 | 60 |
| 11/2-7/23 | 41 | 59 |
| 9/18-25/23 | 43 | 57 |
| 7/7-12/23 | 45 | 55 |
| 5/8-18/23 | 41 | 59 |
| 3/13-22/23 | 44 | 56 |
| 1/9-20/23 | 47 | 53 |
| 11/15-22/22 | 44 | 56 |
| 9/7-14/22 | 40 | 60 |
| 7/5-12/22 | 38 | 61 |
| 5/9-19/22 | 44 | 55 |
| 3/14-24/22 | 54 | 45 |
| 1/10-21/22 | 52 | 46 |
| 11/1-10/21 | 54 | 46 |
| 9/7-16/21 | 49 | 50 |
| 7/16-26/21 | 60 | 39 |
| 9/8-15/20 | 66 | 33 |
| Marquette Law School Poll, national surveys, latest: Oct. 1-10, 2024 | ||
| Question: Overall, how much do you approve or disapprove of the way the U.S. Supreme Court is handling its job? | ||
The latest Marquette Law School Poll’s national Supreme Court survey was conducted Oct. 1-10, 2024. The survey interviewed 1,005 adults nationwide and has a margin of error of +/-4.1 percentage points.
A very large majority, 90%, favor enforcing a strict ethics code for Supreme Court justices, while 10% oppose this. Unlike other views of the Court, partisan differences on this topic are small, with 88% of Republicans and 93% of Democrats in favor of enforcing an ethics code. There is slightly less support from independents, 81%.The public is divided on rating the honesty and ethical standards of the justices, with 27% saying that the justices have very high or high standards, 38% rating their ethical standards as average, and 35% saying the justices’ ethical standards are low or very low. While there is division in views of the Court’s ethical standards, support for an ethics code is high regardless of opinion of the Court’s current standards. Of those who say the Court’s standards are very high or high, 89% are in favor of enforcing an ethics code, while 91% of those saying the current standards are low or very low also are in favor of an ethics code.
There are partisan divides in rating the current ethical standards of the Court, with Republicans giving considerably higher ratings than Democrats, as shown in Table 2.
Table 2: Rating ethical standards of the Supreme Court, by party identification
Among adults
| Party ID | Ethical standards of Court | ||
| Very high/high | Average | Low/Very low | |
| Total | 27 | 38 | 35 |
| Republican | 43 | 42 | 16 |
| Independent | 16 | 44 | 40 |
| Democrat | 14 | 34 | 52 |
| Marquette Law School Poll, national survey, Oct. 1-10, 2024 | |||
| Question: How would you rate the honesty and ethical standards of U.S. Supreme Court justices? | |||
The survey asked about other proposals concerning the Court, besides enforcing a strict ethics code.
The proposal for justices to serve fixed terms, rather than the current system of appointments for life, is very popular. A fixed term is supported by 83%, with 17% opposed. Support for fixed terms has increased from 72% in November 2021 when the poll last included that question. A majority of Republicans, 70%, favor fixed terms, as do 86% of independents and 94% of Democrats.
Opinion is more closely divided on whether to increase the number of justices on the Court, with 54% in favor of and 46% opposed to increasing the size of the Court. There has been a modest growth in support, from 42% in September 2019, for having more members of the Court. There is a large partisan divide on this, with 35% of Republicans, 56% of independents, and 71% of Democrats in favor of expanding the number of justices on the Court.The belief that justices’ decisions are motivated mainly by politics has increased since 2019, with 55% now saying this. The other 45% say justices are mainly motivated by the law. In September 2019, 35% said justices were motivated mainly by politics and 64% said they were motivated mainly by the law.
In 2019, there was almost no partisan difference on whether justices were motivated by the law or by politics. At that time, 66% of Republicans and 65% of Democrats said justices’ opinions were based mainly on the law. In the current poll, 62% of Republicans say mainly the law, while only 27% of Democrats say the same.
Among those polled, 83% say that the choice of the next justice of the Supreme Court is very or somewhat important to them, while 17% say it is not too or not at all important to them. Both Republicans, 83%, and Democrats, 86%, say the choice of justice is very or somewhat important, while 72% of independents say so.
As the Court begins its new annual term, the public is at a low point in attention to news about the Court. Only 19% say they have heard a lot about the Court in the last month, while 61% have heard a little and 20% have heard nothing at all. This is similar to attention to the Court in September and November a year ago. Attention rose over the spring and peaked in July, as the Court ended its term issuing several major decisions. The trend in attention over the past year is shown in Table 3.
Table 3: Attention to news about the Court
Among adults
| Poll dates | How much read or heard about the Court | ||
| A lot | A little | Nothing at all | |
| 10/1-10/24 | 19 | 61 | 20 |
| 7/24-8/1/24 | 32 | 54 | 14 |
| 5/6-15/24 | 27 | 52 | 21 |
| 3/18-28/24 | 30 | 50 | 19 |
| 2/5-15/24 | 24 | 56 | 20 |
| 11/2-7/23 | 15 | 60 | 25 |
| 9/18-25/23 | 17 | 61 | 22 |
| Marquette Law School Poll, national surveys, latest: Oct. 1-10, 2024 | |||
| Question: Thinking about the last month only, how much have you heard or read about the U.S. Supreme Court? | |||
Public opinion about recent decisions
The poll asked about six recent prominent decisions. A majority of the public favors four of these and opposes two of them. Table 4 summarizes opinion about these decisions.
Table 4: Favor or oppose the Court’s decision
Among adults
| Case | Favor or oppose decision | |
| Favor | Oppose | |
| Ban use of race in college admissions | 79 | 21 |
| Right to possess a firearm outside the home | 70 | 30 |
| Maintain current access to abortion medication | 66 | 34 |
| Right to same-sex marriage | 65 | 35 |
| Presidents have immunity for official acts | 39 | 61 |
| Overturn Roe v. Wade | 37 | 63 |
| Marquette Law School Poll, national survey, Oct. 1-10, 2024 | ||
| Question: (Description of the decision) Do you favor or oppose this decision? | ||
| Question: In July, the U.S. Supreme Court ruled that, while there is no immunity for unofficial acts, former presidents have broad immunity from criminal prosecution for official acts as president. | ||
| Question: In June, the U.S. Supreme Court maintained access to a widely available abortion pill, mifepristone, rejecting a bid from a group seeking to undo the Food and Drug Administration’s approval of the pill. | ||
| Question: In 2015, the Supreme Court ruled that the Constitution guarantees a right to same-sex marriage. | ||
| Question: In 2022, the Supreme Court overturned Roe versus Wade, thus striking down the 1973 decision that made abortion legal in all 50 states. | ||
| Question: In 2022, the Supreme Court ruled that, subject to some restrictions, the Second Amendment protects an individual’s right to carry a handgun for self-defense outside the home. | ||
| Question: In 2023, the Supreme Court ruled that colleges cannot use race as a factor in deciding which applicants to admit. | ||
Partisans differ in which decisions they favor. Table 5 shows the percentage of each partisan group that favors each of the six decisions above. A majority of Republicans favor five of the six decisions, while a majority of Democrats and independents favor four of the six. A majority of both parties favor three of the six decisions: right to possess a firearm outside the home, a ban on the use of race in college admissions, and maintaining current access to abortion medication. The parties are in greatest disagreement on presidential immunity and overturning Roe v. Wade. They are in least, but still substantial, disagreement on banning race in admissions and maintaining access to abortion medication.
Table 5: Favor the Court’s decisions, by party identification
Among adults
| Case | Percent of partisan group in favor of decision | |||
| Republican | Independent | Democrat | Net Rep-Dem | |
| Presidents have immunity for official acts | 66 | 33 | 15 | 51 |
| Overturn Roe v. Wade | 62 | 28 | 14 | 48 |
| Right to possess a firearm outside the home | 93 | 55 | 51 | 42 |
| Ban use of race in college admissions | 94 | 83 | 63 | 31 |
| Maintain current access to abortion medication | 55 | 59 | 78 | -23 |
| Right to same-sex marriage | 47 | 64 | 83 | -36 |
| Marquette Law School Poll, national survey, Oct. 1-10, 2024 | ||||
| Question: (Description of the decision) Do you favor or oppose this decision? | ||||
| Question: In July, the U.S. Supreme Court ruled that, while there is no immunity for unofficial acts, former presidents have broad immunity from criminal prosecution for official acts as president. | ||||
| Question: In June, the U.S. Supreme Court maintained access to a widely available abortion pill, mifepristone, rejecting a bid from a group seeking to undo the Food and Drug Administration’s approval of the pill. | ||||
| Question: In 2015, the Supreme Court ruled that the Constitution guarantees a right to same-sex marriage. | ||||
| Question: In 2022, the Supreme Court overturned Roe versus Wade, thus striking down the 1973 decision that made abortion legal in all 50 states. | ||||
| Question: In 2022, the Supreme Court ruled that, subject to some restrictions, the Second Amendment protects an individual’s right to carry a handgun for self-defense outside the home. | ||||
| Question: In 2023, the Supreme Court ruled that colleges cannot use race as a factor in deciding which applicants to admit. | ||||
Turning from partisan groups to ideology: There are similar differences in which issues conservatives, moderates, and liberals favor, as shown in Table 6. Conservatives and liberals are the most divided on overturning Roe v. Wade, right to same-sex marriage, and presidential immunity. There is least, but still substantial, disagreement on access to abortion medication and banning use of race in admissions. At least 50% of conservatives favor five of the six decisions, and at least 49% of liberals favor four of the six decisions.
Table 6: Favor the Court’s decisions, by ideology
Among adults
| Case | Percent of ideological group in favor of decision | |||
| Conservative | Moderate | Liberal | Net Con-Lib | |
| Overturn Roe v. Wade | 66 | 28 | 9 | 57 |
| Presidents have immunity for official acts | 67 | 31 | 12 | 55 |
| Right to possess a firearm outside the home | 93 | 63 | 49 | 44 |
| Ban use of race in college admissions | 92 | 84 | 55 | 37 |
| Maintain current access to abortion medication | 50 | 70 | 84 | -34 |
| Right to same-sex marriage | 41 | 68 | 96 | -55 |
| Marquette Law School Poll, national survey, Oct. 1-10, 2024 | ||||
| Question: (Description of the decision) Do you favor or oppose this decision? | ||||
| Question: In July, the U.S. Supreme Court ruled that, while there is no immunity for unofficial acts, former presidents have broad immunity from criminal prosecution for official acts as president. | ||||
| Question: In June, the U.S. Supreme Court maintained access to a widely available abortion pill, mifepristone, rejecting a bid from a group seeking to undo the Food and Drug Administration’s approval of the pill. | ||||
| Question: In 2015, the Supreme Court ruled that the Constitution guarantees a right to same-sex marriage. | ||||
| Question: In 2022, the Supreme Court overturned Roe versus Wade, thus striking down the 1973 decision that made abortion legal in all 50 states. | ||||
| Question: In 2022, the Supreme Court ruled that, subject to some restrictions, the Second Amendment protects an individual’s right to carry a handgun for self-defense outside the home. | ||||
| Question: In 2023, the Supreme Court ruled that colleges cannot use race as a factor in deciding which applicants to admit. | ||||
The Court has had a majority of justices appointed by Republican presidents for 54 years, since 1970 (with the exception of a 14-month vacancy in 2016-17 which created a 4-4 tie). The current Court has six justices appointed by Republicans and three appointed by Democrats. Nonetheless, 22% of adults believe a majority of justices were definitely or probably appointed by Democratic presidents. Another 43% say a majority were probably appointed by Republican presidents, and 35% say the majority were definitely appointed by Republicans. This opinion has varied modestly since 2019, with a slight increase in the percentage correctly saying that there is definitely a Republican-appointed majority, as shown in Table 7.
Table 7: Majority of Court appointed by which party’s presidents
Among adults
| Poll dates | Majority appointed by | ||
| Definitely/Probably Dem majority | Probably Rep majority | Definitely Rep majority | |
| 10/1-10/24 | 22 | 43 | 35 |
| 7/24-8/1/24 | 24 | 41 | 35 |
| 5/6-15/24 | 28 | 40 | 33 |
| 3/18-28/24 | 25 | 43 | 32 |
| 2/5-15/24 | 29 | 38 | 33 |
| 11/2-7/23 | 26 | 43 | 30 |
| 9/18-25/23 | 26 | 42 | 32 |
| 7/7-12/23 | 22 | 42 | 36 |
| 5/8-18/23 | 29 | 41 | 30 |
| 3/13-22/23 | 27 | 41 | 31 |
| 1/9-20/23 | 23 | 41 | 36 |
| 11/15-22/22 | 24 | 40 | 35 |
| 9/7-14/22 | 22 | 40 | 37 |
| 7/5-12/22 | 20 | 40 | 40 |
| 5/9-19/22 | 31 | 39 | 31 |
| 3/14-24/22 | 28 | 47 | 24 |
| 1/10-21/22 | 23 | 44 | 33 |
| 11/1-10/21 | 28 | 44 | 28 |
| 9/7-16/21 | 25 | 46 | 29 |
| 7/16-26/21 | 24 | 45 | 30 |
| 9/8-15/20 | 28 | 51 | 21 |
| 9/3-13/19 | 27 | 53 | 19 |
| Marquette Law School Poll, national surveys, latest: Oct. 1-10, 2024 | |||
| Question: What is your guess as to whether a majority of the current U.S. Supreme Court justices were appointed by Democratic or Republican presidents? | |||
Confidence in institutions
Confidence in several institutions is summarized in Table 8. Despite criticism over recent assassination attempts by individuals on former President Donald Trump, the U.S. Secret Service has the highest percentage of the public expressing a great deal or a lot of confidence, as among five institutions the survey asked about. The U.S. Supreme Court has the second highest level of confidence, followed very closely by the presidency. The national news media and Congress have the lowest confidence ratings.
Table 8: Confidence in institutions
Among adults
| Institution | Confidence | ||
| Great deal/a lot | Some | Little/None | |
| The U.S. Secret Service | 31 | 39 | 30 |
| U.S. Supreme Court | 27 | 34 | 39 |
| The presidency | 26 | 37 | 37 |
| National news media | 15 | 32 | 53 |
| Congress | 13 | 38 | 49 |
| Marquette Law School Poll, national survey, Oct. 1-10, 2024 | |||
| Question: Here is a list of institutions in American society. How much confidence do you have in each one? | |||
As approval of the Supreme Court has declined, so has confidence in the Court. In 2019, 37% of respondents had a great deal or a lot of confidence in the Court, while 20% had little or no confidence. In this October poll, the balance has reversed, with 27% having a great deal or a lot of confidence, while 39% have little or no confidence. The full trend is shown in Table 9.
Table 9: Confidence in the Supreme Court, 2019-2024
Among adults
| Poll dates | Confidence | ||
| Great deal/a lot | Some | Little/None | |
| 10/1-10/24 | 27 | 34 | 39 |
| 7/24-8/1/24 | 26 | 32 | 42 |
| 5/6-15/24 | 24 | 37 | 40 |
| 3/18-28/24 | 30 | 37 | 33 |
| 2/5-15/24 | 25 | 35 | 40 |
| 11/2-7/23 | 28 | 36 | 36 |
| 9/18-25/23 | 28 | 37 | 35 |
| 7/7-12/23 | 31 | 32 | 37 |
| 5/8-18/23 | 25 | 36 | 39 |
| 3/13-22/23 | 28 | 40 | 32 |
| 1/9-20/23 | 31 | 38 | 31 |
| 11/15-22/22 | 30 | 36 | 34 |
| 9/7-14/22 | 30 | 34 | 36 |
| 7/5-12/22 | 28 | 28 | 44 |
| 9/8-15/20 | 39 | 45 | 16 |
| 9/3-13/19 | 37 | 42 | 20 |
| Marquette Law School Poll, national surveys, latest: Oct. 1-10, 2024 | |||
| Question: Here is a list of institutions in American society. How much confidence do you have in each one? | |||
Perceived ideological leaning of the Court
In October, 24% describe the Supreme Court as “very conservative,” 35% describe it as “somewhat conservative,” and 32% call the Court “moderate,” while 7% see the Court as “somewhat liberal” and 2% believe it is “very liberal.”
Views of the Court have shifted to the right since 2019, with fewer members of the public seeing the Court as moderate and more seeing it as conservative or very conservative, as shown in Table 10. The shift in perceptions is most apparent in May and July 2022, around the time of the Dobbs decision overturning Roe v. Wade.
Table 10: Perceived ideological leaning of the Court, 2019-2024
Among adults
| Poll dates | Perceived ideology | ||||
| Very conservative | Somewhat conservative | Moderate | Somewhat liberal | Very liberal | |
| 10/1-10/24 | 24 | 35 | 32 | 7 | 2 |
| 7/24-8/1/24 | 28 | 30 | 32 | 7 | 3 |
| 5/6-15/24 | 25 | 32 | 31 | 10 | 2 |
| 3/18-28/24 | 25 | 32 | 33 | 8 | 3 |
| 2/5-15/24 | 21 | 34 | 33 | 7 | 5 |
| 11/2-7/23 | 21 | 35 | 32 | 7 | 5 |
| 9/18-25/23 | 20 | 37 | 32 | 7 | 3 |
| 7/7-12/23 | 27 | 35 | 28 | 7 | 3 |
| 5/8-18/23 | 24 | 33 | 30 | 10 | 3 |
| 3/13-22/23 | 23 | 35 | 34 | 6 | 2 |
| 1/9-20/23 | 22 | 37 | 31 | 8 | 2 |
| 11/15-22/22 | 25 | 36 | 32 | 6 | 2 |
| 9/7-14/22 | 29 | 35 | 27 | 5 | 3 |
| 7/5-12/22 | 34 | 33 | 21 | 7 | 3 |
| 5/9-19/22 | 23 | 33 | 34 | 8 | 2 |
| 3/14-24/22 | 15 | 37 | 36 | 10 | 2 |
| 1/10-21/22 | 17 | 38 | 35 | 8 | 2 |
| 11/1-10/21 | 15 | 35 | 39 | 8 | 1 |
| 9/7-16/21 | 16 | 35 | 40 | 7 | 2 |
| 7/16-26/21 | 13 | 37 | 42 | 6 | 1 |
| 9/8-15/20 | 5 | 30 | 54 | 9 | 2 |
| 9/3-13/19 | 5 | 33 | 50 | 9 | 3 |
| Marquette Law School Poll, national surveys, latest: Oct. 1-10, 2024 | |||||
| Question: In general, would you describe each of the following… The U.S. Supreme Court | |||||
About the Marquette Law School Poll
The survey was conducted Oct. 1-10, 2024, interviewing 1,005 adults nationwide, with a margin of error of +/-4.1 percentage points. Interviews were conducted using the SSRS Opinion Panel, a national probability sample with interviews conducted online. The detailed methodology statement, survey instrument, topline results, and crosstabs for this release are available on the Marquette Law School Poll website. Some items from this survey, concerning political topics, were released previously, Oct. 16.
Wording of questions about recent and past Supreme Court decisions: These items do not attempt to exactly frame the particular issues in specific cases but rather address the topic in more general terms.
The wording of questions about recent decisions includes:
Food and Drug Administration v. Alliance for Hippocratic Medicine
- In June, the U.S. Supreme Court maintained access to a widely available abortion pill, mifepristone, rejecting a bid from a group seeking to undo the Food and Drug Administration’s approval of the pill. How much do you favor or oppose this decision?
Trump v. United States
- In July, the U.S. Supreme Court ruled that, while there is no immunity for unofficial acts, former presidents have broad immunity from criminal prosecution for official acts as president. How much do you favor or oppose this decision?
The wording of questions about earlier decisions includes:
Obergefell v. Hodges
- In 2015, the Supreme Court ruled that the Constitution guarantees a right to same-sex marriage. How much do you favor or oppose this decision?
New York State Rifle & Pistol Association Inc. v. Bruen
- In 2022, the Supreme Court ruled that, subject to some restrictions, the Second Amendment protects an individual’s right to carry a handgun for self-defense outside the home. How much do you favor or oppose this decision?
Dobbs v. Jackson Women’s Health Organization
- In 2022, the Supreme Court overturned Roe versus Wade, thus striking down the 1973 decision that made abortion legal in all 50 states. How much do you favor or oppose this decision?
Students for Fair Admissions Inc. v. President & Fellows of Harvard College
- In 2023, the Supreme Court ruled that colleges cannot use race as a factor in deciding which applicants to admit. How much do you favor or oppose this decision?
NOTE: This press release was submitted to Urban Milwaukee and was not written by an Urban Milwaukee writer. While it is believed to be reliable, Urban Milwaukee does not guarantee its accuracy or completeness.
Recent Press Releases by Marquette University

New Marquette Law School Poll finds large majority of Wisconsin voters not yet tuned in to who is running in major 2026 elections
Oct 29th, 2025 by Marquette UniversityNo candidate has established strong position in public favorability in governor, state Supreme Court races; large majorities of voters undecided