
March Home Sales Up 5.2%
1st Quarter Sales Up 3.9%.
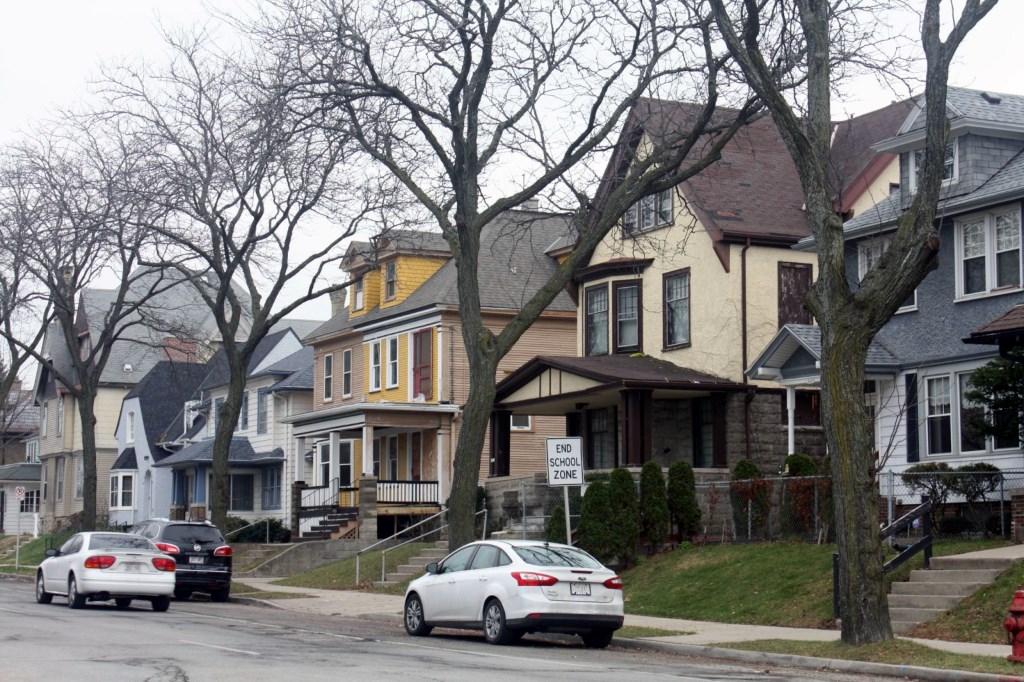
Highland Boulevard homes. Photo by Carl Baehr.
March 11, 2017 – Home sales were up 5.2% in March in the Metropolitan Milwaukee market. This continues the trend of positive sales figures the market has experienced since late 2014.
| County | March Sales | %
Change |
|
| 2016 | 2017 | ||
| Milwaukee | 835 | 885 | 6.0% |
| Waukesha | 393 | 422 | 7.4% |
| Washington | 154 | 146 | -5.2% |
| Ozaukee | 79 | 84 | 6.3% |
| 4 County Area | 1,461 | 1,537 | 5.2% |
Beginning in September 2014, there have only been 4 months of negative home sales (27 months of positive sales).
Three of the metropolitan counties had solid sales in both March and the 1st quarter. Although Washington County was in negative territory, that was most likely due to a lack of inventory for buyers, rather than a lack of interest in purchasing.
| County | 2017 1st Quarter Sales | %
Change |
|
| 2016 | 2017 | ||
| Milwaukee | 1,924 | 2,018 | 4.9% |
| Waukesha | 874 | 920 | 5.3% |
| Washington | 334 | 320 | -4.2% |
| Ozaukee | 193 | 197 | 2.1% |
| 4 County Area | 3,325 | 3,455 | 3.9% |
For the 1st quarter, the metropolitan market saw 3,455 total sales, compared to 3,325 in 2016, a 3.9% increase. The quarter was 7.7% ahead of the 1st quarter in 2015 when there were 3,207 unit sales.
Market conditions are ripe for a strong spring and summer market. Job security and prospects look good, and interest rates continue to hover around historic lows. The biggest cloud on the horizon is the supply of homes, both existing and new construction.
Listings Up
Listings for March were up 4.6%, a remarkable and much needed change in direction for listings. Unfortunately, since June of 2015, there have only been 5 months of positive listing growth (17 negative).
| County | March Listings | %
Change |
|
| 2016 | 2017 | ||
| Milwaukee | 1,539 | 1,625 | 5.6% |
| Waukesha | 755 | 758 | 0.4% |
| Washington | 245 | 270 | 10.2% |
| Ozaukee | 170 | 180 | 5.9% |
| 4 County Area | 2,709 | 2,833 | 4.6% |
For the 1st quarter, listings were barely above water, coming in at 0.1%. The two powerhouses in the market, Milwaukee and Waukesha Counties were flat or negative, in keeping with what the market has experienced over the last 2 years.
| County | 2017 1st Quarter Listings | %
Change |
|
| 2016 | 2017 | ||
| Milwaukee | 3,766 | 3,767 | 0.0% |
| Waukesha | 1,786 | 1,724 | -3.5% |
| Washington | 586 | 587 | 0.2% |
| Ozaukee | 366 | 432 | 18.0% |
| 4 County Area | 6,504 | 6,510 | 0.1% |
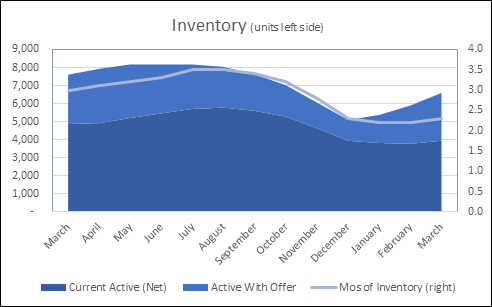
Inventory (units left side)
Inventory Very Tight
The seasonally adjusted inventory level for March was 4.4 months, an increase from February’s 3.8 month level. The seasonally adjusted level was 5.5 months in March 2016.
Subtracting the 2,651 listings with an active offer from current listings presents an effective inventory level of 2.3 months, slightly higher than February’s 2.2 month level. A year ago, the same calculation showed March’s inventory level at 3.0 months.
Average Sale Price
The average sale price in 3 counties was up in the 1st quarter. Waukesha County lead the way with the largest dollar gain. Ozaukee County’s decrease in average sale price is probably not a sign of the direction of the market, but a result of the mixture of homes that sold in the City of Mequon in the 1st quarter of 2016 versus 2017.
| County | Average Sale Price | $
Change |
%
Change |
|
| 2016 | 2017 | |||
| Milwaukee | $154,960 | $161,224 | $6,264 | 4% |
| Waukesha | $284,278 | $292,266 | $7,988 | 3% |
| Washington | $226,191 | $227,881 | $1,690 | 1% |
| Ozaukee | $300,000 | $292,154 | -$7,926 | -3% |
Not Far From Peak
The 4 County market is 4.2% away from its 1st quarter peak average sale price in 2006 of $254,013.
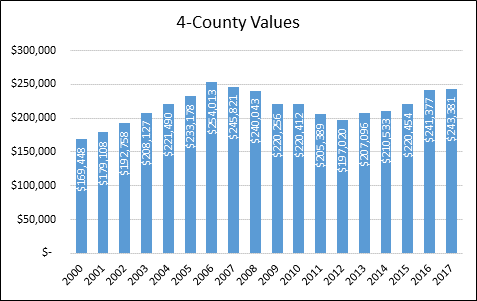
4-County Values
Waukesha County’s 1st quarter peak was in 2006, at $306,344. The county is still 4.6% from that point. Waukesha County is 17.5% from the low point of the market in 2012, when the average sale price was $248,813.
Washington County is only 1% below its 2006 peak price of $230,102, and 24.6% above the bottom of the market in 2013, $182,883.
Ozaukee County peaked in 2006 at $306,935, and is 4.8% away from that price point. Ozaukee has come back 22.4% from the bottom of the market in 2012, when the value was $238,707.
Milwaukee County is 13% from getting back to its 2007 pre-recessionary high of $185,388. The county has the farthest to go because it is the largest market and has the most diverse housing stock in the region. It has gained 43.9% since hitting bottom in 2012, $112,049.
With prices increasing, we should see more listings and sales in the coming months. One factor, however, is putting a damper on more listings and stronger sales, sellers are having a hard time finding a place to move into.
Hottest Markets
The most active markets in the region, characterized by those communities with more than 25 unit sales, that had an increase in units sold and average sale price, and a decrease in days-on-market (DOM):
| Community | Change in Units Sold | Change in Sale Price | % Sale Price Change | Change in DOM |
| Milwaukee | 10% | $ 8,670 | 8% | -22% |
| Shorewood | 14% | $ 55,529 | 16% | -5% |
| S. Milwaukee | 5% | $ 24,044 | 18% | -33% |
| Whitefish Bay | 10% | $ 71,078 | 19% | -20% |
| Port Washington | 21% | $ 27,890 | 14% | -25% |
| Hartford | 13% | $ 21,022 | 11% | -39% |
| Jackson | 4% | $ 26,043 | 12% | -55% |
| Hartland | 13% | $ 45,582 | 19% | -56% |
| Mukwonago | 2.9% | $ 12,648 | 4% | -38% |
| New Berlin | 19% | $ 11,699 | 5% | -44% |
Where to go
Buyers should seek the counsel of a REALTOR® in determining their best housing options, and sellers need a REALTORS® expert advice in making correct marketing decisions with their home.
The Greater Milwaukee Association of REALTORS® is a 4,000-member strong professional organization dedicated to providing information, services and products to “help REALTORS® help their clients” buy and sell real estate. Data for this report was collected by Metro MLS, Inc. a wholly-owned subsidiary of the GMAR.
* Sales and Listing figures differ between the “Monthly Stats” and “4th qtr” (or year-end) because the collection of “Monthly Stats” ends on the 10th of each month; whereas the “4th qtr” is a continuous tally to 12/31. For example, if a sale occurred on July 29th, but the agent does not record the sale until August 11th, that sale would not be included in the July sales figures (or any subsequent month’s total) but would be added to the annual total sales figure in the “4th qtr” total.
Market Highlights
- Trend of Strong Sales Continues
- Listings May Be Coming Out of Doldrums
- Metro Prices Closing In On Peak Years
NOTE: This press release was submitted to Urban Milwaukee and was not written by an Urban Milwaukee writer. While it is believed to be reliable, Urban Milwaukee does not guarantee its accuracy or completeness.
Mentioned in This Press Release
Recent Press Releases by Greater Milwaukee Association of REALTORS®


Inspiration Takes Root at the 2025 REALTORS® Home & Garden Show, March 21 – 30 at the Expo Center at Wisconsin State Fair Park
Jan 20th, 2025 by Greater Milwaukee Association of REALTORS®99th annual show to offer tips and trends in landscaping, gardening, home improvements, interior design and more.