Final pre-election Marquette Law School Poll of Wisconsin voters finds both Senate and governor’s races are tossups
Please note: Complete Poll results and methodology information can be found online at law.marquette.edu/poll
MILWAUKEE – A new Marquette Law School Poll survey of Wisconsin voters finds the races for both U.S. Senate and governor are tossups one week before election day.
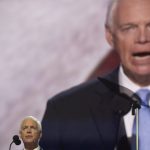
Among likely voters in the election for U.S. Senate, Ron Johnson is supported by 50% and Mandela Barnes by 48%. In the Marquette Law Poll’s previous survey, Oct. 3-9, among likely voters Johnson received 52% and Barnes 46%.
Among registered voters in the current poll, 48% support Johnson and 45% support Barnes. “Likely voters” are those who say they are certain to vote or who say they have already voted. “Registered voters” include those already registered and those who say they will register by election day. All vote results include undecided voters who lean to a candidate.The governor’s race remains a tossup: Among likely voters 48% support Democratic incumbent Gov. Tony Evers, while 48% favor Republican Tim Michels. The independent candidate, Joan Beglinger, is chosen by 2%, while 1% don’t know. Beglinger ended her campaign on September 6 but will remain on the November ballot. In the Oct. 3-9 poll, among likely voters, Evers received 47%, Michels 46% and Beglinger 4%. In the new poll, among registered voters, 44% support Evers, 45% support Michels and 5% support Beglinger.
The survey was conducted Oct. 24-Nov. 1, 2022, interviewing 802 Wisconsin registered voters, with a margin of error of +/-4.6 percentage points. The margin of error among 679 likely voters is +/-4.8 percentage points.
Table 1 shows the vote preference for governor since August among likely voters and among all registered voters. (All results in the tables are stated as percentages; the precise wording of the questions can be found in the online link noted above.)
Table 1: Vote for Governor
(a) Likely voters
| Poll dates | Evers | Michels | Beglinger | Other | Don’t know | Refused |
| 10/24-11/1/22 | 48 | 48 | 2 | 0 | 1 | 0 |
| 10/3-9/22 | 47 | 46 | 4 | 1 | 1 | 1 |
| 9/6-11/22 | 47 | 44 | 5 | 0 | 3 | 0 |
| 8/10-15/22 | 48 | 44 | 4 | 0 | 2 | 1 |
(b) Registered voters
| Poll dates | Evers | Michels | Beglinger | Other | Don’t know | Refused |
| 10/24-11/1/22 | 44 | 45 | 5 | 0 | 3 | 3 |
| 10/3-9/22 | 46 | 41 | 7 | 1 | 3 | 1 |
| 9/6-11/22 | 44 | 43 | 8 | 1 | 4 | 0 |
| 8/10-15/22 | 45 | 43 | 7 | 0 | 3 | 2 |
Table 2 shows the trend in support for the Senate candidates among likely voters and among registered voters since August.
Table 2: Vote for U.S. Senate
(a) Likely voters
| Poll dates | Barnes | Johnson | Neither | Don’t know | Refused |
| 10/24-11/1/22 | 48 | 50 | 0 | 1 | 1 |
| 10/3-9/22 | 46 | 52 | 1 | 1 | 1 |
| 9/6-11/22 | 48 | 49 | 1 | 1 | 0 |
| 8/10-15/22 | 52 | 45 | 0 | 1 | 1 |
(b) Registered voters
| Poll dates | Barnes | Johnson | Neither | Don’t know | Refused |
| 10/24-11/1/22 | 45 | 48 | 2 | 1 | 3 |
| 10/3-9/22 | 47 | 47 | 4 | 2 | 1 |
| 9/6-11/22 | 47 | 48 | 3 | 3 | 0 |
| 8/10-15/22 | 51 | 44 | 1 | 3 | 1 |
Partisan support for the candidates in the race for governor is shown in Table 3 among likely voters. Both Democratic and Republican voters are strongly unified behind their respective party’s candidates, with 95% of Democrats supporting Evers and 97% of Republicans supporting Michels. Forty-seven percent of independents back Evers, while 46% prefer Michels. The independent candidate, Beglinger, receives 5% from independent voters and 1% from Republicans and 1% from Democrats.
Table 3: Vote for Governor by party identification (among likely voters)
(a) Oct. 24-Nov. 1
| Party ID | Evers | Michels | Beglinger | Don’t know | Refused |
| Republican | 2 | 97 | 1 | 0 | 0 |
| Independent | 47 | 46 | 5 | 1 | 0 |
| Democrat | 95 | 2 | 1 | 1 | 0 |
(b) Oct. 3-9
| Party ID | Evers | Michels | Beglinger | Other | Don’t know | Refused |
| Republican | 6 | 88 | 4 | 0 | 2 | 1 |
| Independent | 43 | 44 | 7 | 1 | 1 | 3 |
| Democrat | 96 | 2 | 1 | 0 | 0 | 0 |
(c) Sept. 6-11
| Party ID | Evers | Michels | Beglinger | Other | Don’t know | Refused |
| Republican | 3 | 92 | 2 | 0 | 3 | 1 |
| Independent | 45 | 39 | 11 | 0 | 5 | 0 |
| Democrat | 95 | 4 | 2 | 0 | 0 | 0 |
(d) Aug. 10-15
| Party ID | Evers | Michels | Beglinger | Other | Don’t know | Refused |
| Republican | 5 | 92 | 2 | 0 | 1 | 0 |
| Independent | 49 | 38 | 7 | 0 | 4 | 2 |
| Democrat | 94 | 2 | 3 | 0 | 0 | 1 |
Partisan support for the U.S. Senate candidates is shown in Table 4 among likely voters. Partisans are strongly aligned with their party’s candidates, with 98% of Democrats supporting Barnes and 97% of Republicans supporting Johnson. Forty-six percent of independents back Barnes, while 53% prefer Johnson. In early October 45% favored Barnes and 51% backed Johnson.
Table 4: Vote for U.S. Senate by party identification (among likely voters)
(a) Oct. 24-Nov. 1
| Party ID | Barnes | Johnson | Neither | Don’t know | Refused |
| Republican | 3 | 97 | 0 | 0 | 0 |
| Independent | 46 | 53 | 1 | 0 | 0 |
| Democrat | 98 | 0 | 0 | 2 | 0 |
(b) Oct. 3-9
| Party ID | Barnes | Johnson | Neither | Don’t know | Refused |
| Republican | 3 | 96 | 0 | 0 | 1 |
| Independent | 45 | 51 | 3 | 1 | 1 |
| Democrat | 93 | 5 | 0 | 2 | 0 |
(c) Sept. 6-11
| Party ID | Barnes | Johnson | Neither | Don’t know | Refused |
| Republican | 2 | 97 | 1 | 0 | 0 |
| Independent | 46 | 48 | 2 | 3 | 0 |
| Democrat | 96 | 4 | 0 | 0 | 0 |
(d) Aug. 10-15
| Party ID | Barnes | Johnson | Neither | Don’t know | Refused |
| Republican | 6 | 94 | 0 | 0 | 0 |
| Independent | 55 | 40 | 0 | 3 | 3 |
| Democrat | 99 | 0 | 0 | 0 | 0 |
Among Republicans, 83% are “likely voters”: that is, they say they are absolutely certain to vote in November’s elections or have already voted. The same is true of 89% of Democrats and 72% of independents. Early voting accounts for some of the Democratic advantage in those percentages, with 10% of Democrats saying they have already voted compared to 3% of Republicans. Those who have already voted are included in the percentages who are certain to vote. Certainty of voting by party is shown in Table 5; those who have already voted are included in the percentages who are “absolutely certain” to vote. In early October, Republicans were slightly more likely than Democrats to say they were certain to vote.
Table 5: What are the chances that you will vote in the November 2022 general election for governor, Congress, and other offices – are you absolutely certain to vote, very likely to vote, are the chances 50-50, or don’t you think you will vote? (“Absolutely certain” includes those who have already voted) by party identification
(a) Oct. 24-Nov. 1
| Party ID | Absolutely certain | Very likely | 50-50 | Will not vote | Refused |
| Republican | 83 | 10 | 5 | 2 | 0 |
| Independent | 72 | 13 | 9 | 6 | 1 |
| Democrat | 89 | 5 | 2 | 3 | 0 |
(b) Oct. 3-9
| Party ID | Absolutely certain | Very likely | 50-50 | Will not vote |
| Republican | 84 | 11 | 4 | 1 |
| Independent | 69 | 17 | 11 | 3 |
| Democrat | 83 | 10 | 7 | 0 |
(c) Sept. 6-11
| Party ID | Absolutely certain | Very likely | 50-50 | Will not vote |
| Republican | 77 | 16 | 3 | 3 |
| Independent | 71 | 13 | 12 | 3 |
| Democrat | 80 | 12 | 7 | 0 |
(d) Aug. 10-15
| Party ID | Absolutely certain | Very likely | 50-50 | Will not vote |
| Republican | 83 | 11 | 4 | 2 |
| Independent | 66 | 16 | 14 | 3 |
| Democrat | 82 | 8 | 5 | 5 |
The effect of different levels of turnout on the vote for governor is shown in Table 6. The first row shows preference among all registered voters, while the second row shows the results for an electorate composed of those either “absolutely certain” to vote or “very likely” to vote. The third row shows the results among only the most likely voters: those who say they are “absolutely certain” to vote. (As explained above and consistently with past practice, this last group constitutes “likely voters” in this release.)
Table 6: Vote for Governor by certainty of voting
| How likely to vote | Evers | Michels | Beglinger | Other | Don’t know |
| All registered voters | 44 | 45 | 5 | 0 | 3 |
| Absolutely certain or very likely to vote | 47 | 47 | 4 | 0 | 2 |
| Absolutely certain to vote only | 48 | 48 | 2 | 0 | 1 |
The vote preferences of those less than certain to vote differ from the preferences among those certain to vote, which also affects the difference in vote margin between “likely voters” and all registered voters. Table 7 shows vote for governor comparing those absolutely certain to vote (“likely voters”) and those who say they are not certain to vote. Those less than certain to vote support Michels over Evers but are also much more likely to choose the independent candidate, to say they don’t know or to refuse to say.
Table 7: Vote for governor by whether people are certain or less than certain to vote
| Certainty of voting | Evers | Michels | Beglinger | Other | Don’t know | Refused |
| Absolutely certain | 48 | 48 | 2 | 0 | 1 | 0 |
| Less than certain | 31 | 34 | 16 | 0 | 11 | 9 |
Table 8 shows the vote for U.S. Senate by certainty of voting.
Table 8: Vote for U.S. Senate by certainty of voting
| How likely to vote | Barnes | Johnson | Neither | Don’t know |
| All registered voters | 45 | 48 | 2 | 1 |
| Absolutely certain or very likely to vote | 48 | 49 | 1 | 1 |
| Absolutely certain to vote only | 48 | 50 | 0 | 1 |
Table 9 shows vote preference for Senate comparing those who say they are absolutely certain to vote and those who say they are not. As with the vote for governor, the less likely give an edge to the Republican, Johnson, although those less likely to vote are also far more likely to not favor either candidate than are those absolutely certain to vote.
Table 9: Vote for U.S. Senate by whether people are certain or less than certain to vote
| Certainty of voting | Barnes | Johnson | Neither | Don’t know | Refused |
| Absolutely certain | 48 | 50 | 0 | 1 | 1 |
| Less than certain | 33 | 43 | 8 | 4 | 11 |
Those who are not certain to vote are much less enthusiastic about voting and pay less attention to politics than are those certain to vote, as shown in Table 10 (a) and Table 10 (b).
Table 10: Enthusiasm and attention to politics by certainty of voting
(a) How enthusiastic are you about voting in the elections this November for governor, senator, and other offices?
| Certainty of voting | Very | Somewhat | Not too | Not at all | Don’t know | Refused |
| Absolutely certain | 79 | 13 | 3 | 4 | 1 | 0 |
| Less than certain | 11 | 41 | 13 | 33 | 2 | 0 |
(b) Some people seem to follow what’s going on in politics most of the time, whether there’s an election going on or not. Others aren’t that interested. Would you say you follow what’s going on in politics …?
| Certainty of voting | Most of the time | Some of the time | Only now and then | Hardly at all | Refused |
| Absolutely certain | 77 | 19 | 3 | 1 | 0 |
| Less than certain | 36 | 17 | 24 | 23 | 0 |
Perceived candidate traits
Table 11 shows the favorable and unfavorable ratings of the candidates among all registered voters since June, along with those who say they haven’t heard enough or don’t know.
The non-incumbents have become substantially better known following their primary victories on Aug. 9, although they remain less well known than the incumbents.
Table 11: Do you have a favorable or unfavorable opinion of [INSERT NAME] or haven’t you heard enough about them yet? (among registered voters)
(a) Evers
| Poll dates | Favorable | Unfavorable | Haven’t heard enough | Don’t know | Refused |
| 10/24-11/1/22 | 44 | 46 | 6 | 3 | 1 |
| 10/3-9/22 | 44 | 46 | 6 | 3 | 1 |
| 9/6-11/22 | 45 | 45 | 7 | 3 | 0 |
| 8/10-15/22 | 46 | 41 | 6 | 6 | 0 |
| 6/14-20/22 | 44 | 42 | 11 | 2 | 0 |
(b) Michels
| Poll dates | Favorable | Unfavorable | Haven’t heard enough | Don’t know | Refused |
| 10/24-11/1/22 | 39 | 39 | 16 | 5 | 1 |
| 10/3-9/22 | 36 | 36 | 20 | 7 | 1 |
| 9/6-11/22 | 34 | 39 | 19 | 8 | 1 |
| 8/10-15/22 | 33 | 33 | 24 | 10 | 0 |
| 6/14-20/22 | 22 | 22 | 51 | 5 | 0 |
(c) Beglinger
| Poll dates | Favorable | Unfavorable | Haven’t heard enough | Don’t know | Refused |
| 10/24-11/1/22 | 1 | 3 | 63 | 31 | 1 |
| 10/3-9/22 | 1 | 6 | 66 | 26 | 1 |
| 9/6-11/22 | 3 | 6 | 63 | 28 | 0 |
(d) Barnes
| Poll dates | Favorable | Unfavorable | Haven’t heard enough | Don’t know | Refused |
| 10/24-11/1/22 | 40 | 44 | 11 | 4 | 1 |
| 10/3-9/22 | 39 | 40 | 15 | 6 | 0 |
| 9/6-11/22 | 33 | 32 | 25 | 9 | 1 |
| 8/10-15/22 | 37 | 22 | 30 | 11 | 0 |
| 6/14-20/22 | 21 | 16 | 57 | 6 | 0 |
(e) Johnson
| Poll dates | Favorable | Unfavorable | Haven’t heard enough | Don’t know | Refused |
| 10/24-11/1/22 | 43 | 46 | 7 | 3 | 1 |
| 10/3-9/22 | 41 | 45 | 9 | 4 | 1 |
| 9/6-11/22 | 39 | 47 | 11 | 3 | 1 |
| 8/10-15/22 | 38 | 47 | 9 | 6 | 0 |
| 6/14-20/22 | 37 | 46 | 14 | 2 | 0 |
Table 12 shows the perceptions of which candidates better understand the problems of ordinary people in Wisconsin over the course of the fall campaign.
Table 12: Who do you think better understands the problems faced by ordinary people in Wisconsin, …? (among registered voters)
(a) … Tony Evers or Tim Michels?
| Poll dates | Tony Evers | Tim Michels | Both | Neither | Don’t know | Refused |
| 10/24-11/1/22 | 48 | 44 | 0 | 2 | 5 | 1 |
| 10/3-9/22 | 47 | 39 | 0 | 5 | 7 | 0 |
| 9/6-11/22 | 47 | 41 | 0 | 4 | 7 | 0 |
(b) … Mandela Barnes or Ron Johnson?
| Poll dates | Mandela Barnes | Ron Johnson | Both | Neither | Don’t know | Refused |
| 10/24-11/1/22 | 44 | 45 | 0 | 2 | 7 | 1 |
| 10/3-9/22 | 47 | 40 | 1 | 5 | 8 | 0 |
| 9/6-11/22 | 44 | 40 | 1 | 6 | 9 | 0 |
Table 13 shows the perception that candidates “share my values.” There has been some increase in the percentage of those polled who say the candidates “don’t share my values,” with less change in the percentage perceiving shared values. These shifts are somewhat larger for the non-incumbent candidates, Michels and Barnes, who were less well known at the beginning of the fall campaign.
Table 13: For each of the following candidates, would you say they are someone who shares your values or don’t they share your values? (among registered voters)
| Candidate | Poll dates | Shares values | Doesn’t share values | Don’t know |
| Evers | 10/24-11/1/22 | 48 | 46 | 6 |
| Evers | 10/3-9/22 | 48 | 47 | 5 |
| Evers | 9/6-11/22 | 47 | 48 | 5 |
| Evers | 8/10-15/22 | 50 | 41 | 9 |
| Michels | 10/24-11/1/22 | 41 | 47 | 11 |
| Michels | 10/3-9/22 | 43 | 45 | 12 |
| Michels | 9/6-11/22 | 41 | 47 | 11 |
| Michels | 8/10-15/22 | 38 | 38 | 23 |
| Barnes | 10/24-11/1/22 | 44 | 46 | 9 |
| Barnes | 10/3-9/22 | 44 | 44 | 12 |
| Barnes | 9/6-11/22 | 44 | 41 | 15 |
| Barnes | 8/10-15/22 | 45 | 31 | 24 |
| Johnson | 10/24-11/1/22 | 44 | 49 | 7 |
| Johnson | 10/3-9/22 | 46 | 47 | 7 |
| Johnson | 9/6-11/22 | 42 | 51 | 7 |
| Johnson | 8/10-15/22 | 40 | 50 | 10 |
Table 14 shows the perception that candidates “care about people like you.” The images of the challengers, Michels and Barnes, have seen shifts with fewer saying they don’t know enough and increases in the percent saying a candidate “doesn’t care,” while the percent saying “cares” has changed little. The images of the two incumbents, Evers and Johnson, have barely shifted since August.
Table 14: For each of the following candidates, would you say they are someone who cares about people like you, or don’t they care about people like you? (among registered voters)
| Candidate | Poll dates | Cares | Doesn’t care | Don’t know |
| Evers | 10/24-11/1/22 | 52 | 40 | 8 |
| Evers | 8/10-15/22 | 54 | 38 | 9 |
| Michels | 10/24-11/1/22 | 43 | 46 | 11 |
| Michels | 8/10-15/22 | 38 | 38 | 23 |
| Barnes | 10/24-11/1/22 | 49 | 42 | 8 |
| Barnes | 8/10-15/22 | 50 | 27 | 23 |
| Johnson | 10/24-11/1/22 | 43 | 49 | 7 |
| Johnson | 8/10-15/22 | 41 | 49 | 10 |
Evers job approval
Table 15 shows approval since Feb. 2022 of how Evers has handled his job as governor. After declining net approval for much of the year, there have been slight upturns in the last two polls, with approval at 46% and disapproval at 47% in the latest survey.
Table 15: Overall, do you approve or disapprove of the way Tony Evers is handling his job as Governor of Wisconsin? (among registered voters)
| Poll dates | Net approval | Approve | Disapprove | Don’t know | Refused |
| 10/24-11/1/22 | -1 | 46 | 47 | 6 | 2 |
| 10/3-9/22 | -2 | 46 | 48 | 5 | 1 |
| 9/6-11/22 | -3 | 44 | 47 | 8 | 0 |
| 8/10-15/22 | 2 | 47 | 45 | 8 | 1 |
| 6/14-20/22 | 3 | 48 | 45 | 6 | 1 |
| 4/19-24/22 | 6 | 49 | 43 | 7 | 1 |
| 2/22-27/22 | 9 | 50 | 41 | 8 | 1 |
Important issues
In each Marquette Law School poll since August 2021, respondents have been asked to rate how concerned they are with a variety of issues. Table 16 shows the concern with nine issues in the current survey, sorted from highest to lowest percent saying they are “very concerned.”
Table 16: How concerned are you about each of the following? Are you very concerned, somewhat concerned, not too concerned, or not at all concerned with … (among registered voters)
| Issue | Very concerned | Somewhat concerned | Not too concerned | Not at all concerned |
| Inflation | 68 | 24 | 6 | 2 |
| Public Schools | 62 | 28 | 5 | 5 |
| Crime | 57 | 28 | 11 | 3 |
| Gun violence | 56 | 25 | 10 | 7 |
| Accurate vote count | 56 | 17 | 13 | 13 |
| Abortion policy | 52 | 26 | 9 | 9 |
| Taxes | 48 | 36 | 12 | 3 |
| Illegal immigration | 40 | 29 | 16 | 15 |
| Coronavirus | 16 | 36 | 22 | 26 |
Inflation ranks as the top issue concern in this poll. After peaking in June, concern about inflation has been slightly lower since then but remains atop the list.
Table 17: Concern about inflation, Aug. 2021-Oct. 2022 (among registered voters)
| Poll dates | Very concerned | Somewhat concerned | Not too concerned | Not at all concerned |
| 10/24-11/1/22 | 68 | 24 | 6 | 2 |
| 10/3-9/22 | 68 | 25 | 5 | 1 |
| 9/6-11/22 | 70 | 24 | 5 | 2 |
| 8/10-15/22 | 67 | 27 | 4 | 0 |
| 6/14-20/22 | 75 | 20 | 4 | 1 |
| 4/19-24/22 | 69 | 23 | 6 | 1 |
| 2/22-27/22 | 68 | 28 | 3 | 1 |
| 10/26-31/21 | 64 | 28 | 6 | 1 |
| 8/3-8/21 | 49 | 35 | 11 | 3 |
Partisans differ substantially in their concern over particular issues, as shown in Table 18. Panel (a) is sorted by Republican concern. Panel (b) is sorted by concern among Democrats. Panel (c) is sorted by concern among independents. The entries are the percent of each partisan group who say they are “very concerned” about the issue. Republicans and Democrats have different top concerns—an accurate vote count and inflation for Republicans, and abortion policy and gun violence for Democrats—while independents put inflation and public schools as their top concerns.
Table 18: Issue concerns by party identification, percent “very concerned” (among registered voters)
(a) Sorted by concern among Republicans
| Issue | Republican | Independent | Democrat |
| Accurate vote count | 81 | 50 | 38 |
| Inflation | 80 | 78 | 38 |
| Crime | 79 | 55 | 37 |
| Illegal immigration | 71 | 38 | 9 |
| Taxes | 62 | 54 | 21 |
| Public schools | 58 | 64 | 62 |
| Gun violence | 44 | 53 | 76 |
| Abortion policy | 33 | 47 | 81 |
| Coronavirus | 8 | 14 | 21 |
(b) Sorted by concern among Democrats
| Issue | Republican | Independent | Democrat |
| Abortion policy | 33 | 47 | 81 |
| Gun violence | 44 | 53 | 76 |
| Public schools | 58 | 64 | 62 |
| Accurate vote count | 81 | 50 | 38 |
| Inflation | 80 | 78 | 38 |
| Crime | 79 | 55 | 37 |
| Coronavirus | 8 | 14 | 21 |
| Taxes | 62 | 54 | 21 |
| Illegal immigration | 71 | 38 | 9 |
(c) Sorted by concern among Independents
| Issue | Republican | Independent | Democrat |
| Inflation | 80 | 78 | 38 |
| Public schools | 58 | 64 | 62 |
| Crime | 79 | 55 | 37 |
| Taxes | 62 | 54 | 21 |
| Gun violence | 44 | 53 | 76 |
| Accurate vote count | 81 | 50 | 38 |
| Abortion policy | 33 | 47 | 81 |
| Illegal immigration | 71 | 38 | 9 |
| Coronavirus | 8 | 14 | 21 |
Abortion
Awareness of the Supreme Court’s decision in June that overturned Roe v. Wade remains quite high. Seventy-eight percent say they have heard a lot about the decision, 19% have heard a little and 2% have heard nothing at all. Awareness has changed little since August, when 79% had heard a lot, 17% had heard a little and 3% had heard nothing at all. Table 19 shows attention to the decision by party identification in the current poll.
Table 19: How much have you heard or read about a recent United States Supreme Court decision on abortion? total and by party identification (among registered voters)
| Party ID | A lot | A little | Nothing at all | Don’t know |
| Total | 78 | 19 | 2 | 0 |
| Republican | 75 | 22 | 3 | 0 |
| Independent | 77 | 20 | 2 | 0 |
| Democrat | 85 | 14 | 1 | 0 |
The decision to overturn Roe v. Wade is opposed by a majority of Wisconsin registered voters, including majorities of independents and Democrats, while it is favored by a majority of Republicans in the state, as shown in Table 20.
Table 20: Do you favor or oppose the recent Supreme Court decision to overturn Roe versus Wade, thus striking down the 1973 decision that made abortion legal in all 50 states? Total and by party identification (among registered voters)
(a) Oct. 24-Nov. 1
| Party ID | Favor | Oppose | Haven’t heard of decision | Don’t Know | Refused |
| Total | 37 | 55 | 0 | 6 | 2 |
| Republican | 72 | 22 | 0 | 5 | 1 |
| Independent | 35 | 52 | 1 | 9 | 3 |
| Democrat | 4 | 92 | 0 | 2 | 1 |
(b) Oct. 3-9
| Party ID | Favor | Oppose | Haven’t heard of decision | Don’t Know | Refused |
| Total | 33 | 60 | 1 | 4 | 2 |
| Republican | 61 | 32 | 1 | 3 | 3 |
| Independent | 30 | 60 | 1 | 6 | 2 |
| Democrat | 7 | 89 | 1 | 3 | 0 |
(c) Sept. 6-11
| Party ID | Favor | Oppose | Haven’t heard of decision | Don’t Know | Refused |
| Total | 30 | 63 | 0 | 5 | 2 |
| Republican | 59 | 29 | 0 | 8 | 4 |
| Independent | 28 | 66 | 0 | 5 | 1 |
| Democrat | 3 | 95 | 0 | 2 | 0 |
(d) Aug. 10-15
| Party ID | Favor | Oppose | Haven’t heard of decision | Don’t Know | Refused |
| Total | 33 | 60 | 1 | 4 | 2 |
| Republican | 62 | 28 | 0 | 8 | 2 |
| Independent | 31 | 62 | 2 | 2 | 3 |
| Democrat | 5 | 92 | 0 | 2 | 1 |
The respondents overwhelmingly support allowing legal abortions in the case of rape or incest. Support within each partisan group is 70% or more, as shown in Table 21.
Table 21: Do you think Wisconsin should or should not allow a woman to obtain a legal abortion if she became pregnant as the result of rape or incest? Total and by party identification (among registered voters)
(a) Oct. 24-Nov. 1
| Party ID | Should allow | Should not allow | Don’t Know | Refused |
| Total | 84 | 10 | 4 | 2 |
| Republican | 73 | 21 | 4 | 2 |
| Independent | 83 | 8 | 5 | 4 |
| Democrat | 97 | 3 | 1 | 0 |
(b) Oct. 3-9
| Party ID | Should allow | Should not allow | Don’t Know | Refused |
| Total | 83 | 11 | 4 | 2 |
| Republican | 72 | 19 | 7 | 2 |
| Independent | 83 | 9 | 5 | 3 |
| Democrat | 95 | 4 | 0 | 1 |
(c) Sept. 6-11
| Party ID | Should allow | Should not allow | Don’t Know | Refused |
| Total | 83 | 10 | 5 | 2 |
| Republican | 70 | 20 | 8 | 3 |
| Independent | 83 | 9 | 6 | 2 |
| Democrat | 96 | 2 | 2 | 0 |
Schools
If asked to choose between increasing state support for students to attend private schools or increasing funding for public schools, 29% favor more money for private school students while 63% prefer more state money go to public schools. Views on this issue differ by party identification, as shown in Table 22.
Table 22: If you were making the choice for the next Wisconsin state budget between increasing state support for students to attend private schools or increasing state support for public schools, which would you favor, private schools or public schools? total and by party identification (among registered voters)
| Party ID | Private schools | Public schools | Both equally (VOL) | Neither (VOL) | Don’t know |
| Total | 29 | 63 | 3 | 1 | 3 |
| Republican | 49 | 40 | 1 | 2 | 6 |
| Independent | 30 | 62 | 3 | 1 | 3 |
| Democrat | 7 | 90 | 2 | 0 | 1 |
Forty-six percent of registered voters say it is more important to reduce property taxes when compared to increasing spending on public schools, while 48% say it is more important to increase spending on public schools. When asked in early October, 42% said reduce property taxes and 52% said increase spending on public schools. Table 23 shows the partisan divide on support for property tax cuts vs. spending on schools in the current survey.
Table 23: Which is more important to you: reduce property taxes or increase spending on public schools? Total and by party identification (among registered voters)
| Party ID | Reducing property taxes | Increasing spending on public schools | Don’t know | Refused |
| Total | 46 | 48 | 5 | 1 |
| Republican | 72 | 20 | 8 | 1 |
| Independent | 47 | 48 | 3 | 1 |
| Democrat | 16 | 80 | 4 | 0 |
Opinion on the choice between reducing property taxes and increasing funding for public schools has varied substantially over time. There had been more concern about property taxes prior to 2015, when support for school funding surged. The gap between the two options has narrowed since 2020, as shown in Table 24
Table 24: Which is more important to you: reduce property taxes or increase spending on public schools? (among registered voters)
| Poll dates | Reducing property taxes | Increasing spending on public schools | Don’t know | Refused |
| 10/24-11/1/22 | 46 | 48 | 5 | 1 |
| 10/3-9/22 | 42 | 52 | 5 | 0 |
| 9/6-11/22 | 41 | 51 | 5 | 3 |
| 8/10-15/22 | 43 | 52 | 5 | 0 |
| 4/19-24/22 | 46 | 50 | 4 | 0 |
| 8/3-8/21 | 42 | 52 | 5 | 1 |
| 2/19-23/20 | 38 | 56 | 5 | 1 |
| 1/8-12/20 | 41 | 55 | 4 | 1 |
| 1/16-20/19 | 39 | 55 | 6 | 0 |
| 10/24-28/18 | 40 | 55 | 4 | 1 |
| 10/3-7/18 | 37 | 57 | 6 | 1 |
| 9/12-16/18 | 38 | 57 | 5 | 0 |
| 8/15-19/18 | 32 | 61 | 5 | 1 |
| 6/13-17/18 | 35 | 59 | 5 | 0 |
| 2/25-3/1/18 | 33 | 63 | 3 | 1 |
| 4/7-10/15 | 40 | 54 | 5 | 1 |
| 5/6-9/13 | 49 | 46 | 4 | 1 |
| 3/11-13/13 | 49 | 46 | 4 | 1 |
State funding for police
There is very high support for the state to increase funding for police, with 78% in favor of more state aid for police while 15% are opposed. Majorities of each partisan group support an increase in state support for police.
Table 25: Do you favor or oppose increasing state funding for local police in Wisconsin? Total and by party identification (among registered voters)
| Party ID | Favor | Oppose | Don’t Know | Refused |
| Total | 78 | 15 | 6 | 2 |
| Republican | 95 | 2 | 3 | 1 |
| Independent | 80 | 12 | 7 | 1 |
| Democrat | 58 | 32 | 7 | 3 |
Parental leave
A majority, 73%, favor requiring businesses to provide paid leave for new parents, while 18% are opposed. In August, 78% favored this and 17% were opposed. Majorities of each partisan group favor a parental leave policy, as shown in Table 26.
Table 26: Do you favor or oppose a proposal that would require businesses to provide paid family leave for mothers and fathers of new babies? Total and by party identification (among registered voters)
| Party ID | Favor | Oppose | Don’t Know | Refused |
| Total | 73 | 18 | 8 | 2 |
| Republican | 62 | 26 | 10 | 2 |
| Independent | 65 | 23 | 10 | 2 |
| Democrat | 95 | 3 | 2 | 0 |
Direction of state and family financial situation
A majority of respondents, 58%, think the state is off on the wrong track, while 34% say it is headed in the right direction. The trend since 2020 is shown in Table 27.
Table 27: Thinking just about the state of Wisconsin, do you feel things in Wisconsin are generally going in the right direction, or do you feel things have gotten off on the wrong track? (among registered voters)
| Poll dates | Right direction | Wrong track | Don’t know | Refused |
| 10/24-11/1/22 | 34 | 58 | 8 | 1 |
| 10/3-9/22 | 31 | 63 | 6 | 0 |
| 9/6-11/22 | 40 | 53 | 7 | 1 |
| 8/10-15/22 | 35 | 56 | 9 | 0 |
| 6/14-20/22 | 37 | 56 | 6 | 0 |
| 4/19-24/22 | 36 | 56 | 7 | 0 |
| 2/22-27/22 | 39 | 53 | 8 | 1 |
| 10/26-31/21 | 41 | 51 | 7 | 1 |
| 8/3-8/21 | 39 | 52 | 9 | 0 |
| 3/24-29/20 | 61 | 30 | 9 | 1 |
| 2/19-23/20 | 52 | 39 | 8 | 0 |
| 1/8-12/20 | 46 | 47 | 6 | 1 |
The percentage saying their family is “living comfortably” has declined since 2020, while percentages of those “just getting by” and “struggling” have risen, as shown in Table 28.
Table 28: Thinking about your family’s financial situation, would you say you are living comfortably, just getting by, or struggling to make ends meet? (among registered voters)
| Poll dates | Living comfortably | Just getting by | Struggling | Don’t know | Refused |
| 10/24-11/1/22 | 50 | 38 | 10 | 0 | 1 |
| 10/3-9/22 | 53 | 35 | 11 | 1 | 0 |
| 9/6-11/22 | 56 | 33 | 11 | 0 | 0 |
| 8/10-15/22 | 54 | 36 | 10 | 0 | 1 |
| 8/3-8/21 | 60 | 31 | 7 | 0 | 1 |
| 10/21-25/20 | 67 | 26 | 6 | 0 | 1 |
| 9/30-10/4/20 | 60 | 30 | 9 | 1 | 1 |
| 8/30-9/3/20 | 60 | 32 | 8 | 0 | 1 |
| 8/4-9/20 | 63 | 28 | 8 | 1 | 0 |
| 6/14-18/20 | 61 | 31 | 6 | 1 | 1 |
| 5/3-7/20 | 61 | 28 | 9 | 0 | 1 |
| 3/24-29/20 | 59 | 30 | 10 | 0 | 0 |
| 2/19-23/20 | 62 | 29 | 8 | 0 | 1 |
| 1/8-12/20 | 63 | 28 | 8 | 0 | 0 |
| 12/3-8/19 | 62 | 27 | 11 | 1 | 1 |
| 11/13-17/19 | 66 | 25 | 8 | 0 | 1 |
| 8/25-29/19 | 59 | 30 | 9 | 1 | 0 |
| 4/3-7/19 | 59 | 31 | 9 | 0 | 0 |
| 1/16-20/19 | 60 | 30 | 9 | 1 | 0 |
| 10/24-28/18 | 60 | 30 | 9 | 0 | 1 |
| 10/3-7/18 | 63 | 29 | 7 | 0 | 0 |
| 9/12-16/18 | 56 | 32 | 12 | 1 | 0 |
| 8/15-19/18 | 63 | 28 | 9 | 0 | 0 |
| 6/13-17/18 | 58 | 30 | 11 | 1 | 1 |
| 2/25-3/1/18 | 54 | 34 | 10 | 1 | 0 |
| 6/22-25/17 | 53 | 32 | 14 | 1 | 0 |
| 3/13-16/17 | 54 | 35 | 11 | 1 | 0 |
| 10/26-31/16 | 50 | 35 | 14 | 0 | 1 |
| 10/6-9/16 | 47 | 38 | 15 | 0 | 0 |
| 9/15-18/16 | 53 | 34 | 11 | 1 | 1 |
| 8/25-28/16 | 53 | 33 | 13 | 0 | 0 |
| 6/9-12/16 | 50 | 37 | 12 | 0 | 0 |
| 3/24-28/16 | 51 | 38 | 10 | 1 | 0 |
Confidence in the 2022 and 2020 elections
Voters express more confidence that votes in this November’s election will be accurately cast and counted than they do, looking back, for the 2020 presidential election. Among registered voters 77% say they are very or somewhat confident and 20% say they are not too confident or not at all confident the upcoming election results will be accurate. The breakdown by party is shown in Table 29.
Table 29: How confident are you that, here in Wisconsin, the votes in this November’s election will be accurately cast and counted? Total and by party identification (among registered voters)
| Party ID | Very confident | Somewhat confident | Not too confident | Not at all confident | Don’t know | Refused |
| Total | 45 | 32 | 12 | 8 | 2 | 2 |
| Republican | 20 | 43 | 23 | 10 | 3 | 1 |
| Independent | 42 | 32 | 11 | 12 | 1 | 1 |
| Democrat | 76 | 21 | 1 | 0 | 0 | 2 |
Opinion on the accuracy of the results of the 2020 presidential election continues to sharply divide the public, with 65% saying they are very or somewhat confident and 33% saying they are not too confident or not at all confident in the election result. These views overall and by party identification are shown in Table 30.
Table 30: How confident are you that, here in Wisconsin, the votes for president were accurately cast and counted in the 2020 election? Total and by party identification (among registered voters)
| Party ID | Very confident | Somewhat confident | Not too confident | Not at all confident | Don’t know | Refused |
| Total | 46 | 19 | 14 | 19 | 3 | 1 |
| Republican | 12 | 26 | 27 | 33 | 0 | 1 |
| Independent | 45 | 16 | 13 | 21 | 6 | 0 |
| Democrat | 85 | 13 | 0 | 0 | 1 | 0 |
Table 31 shows the trend in 2020 election confidence.
Table 31: How confident are you that, here in Wisconsin, the votes for president were accurately cast and counted in the 2020 election? (among registered voters)
| Poll dates | Very confident | Somewhat confident | Not too confident | Not at all confident | Don’t know | Refused |
| 10/24-11/1/22 | 46 | 19 | 14 | 19 | 3 | 1 |
| 10/3-9/22 | 48 | 15 | 15 | 19 | 3 | 0 |
| 9/6-11/22 | 46 | 19 | 16 | 18 | 1 | 0 |
| 8/10-15/22 | 48 | 18 | 15 | 17 | 2 | 1 |
| 6/14-20/22 | 51 | 16 | 11 | 21 | 0 | 0 |
| 4/19-24/22 | 48 | 16 | 12 | 23 | 1 | 0 |
| 2/22-27/22 | 48 | 19 | 11 | 19 | 2 | 0 |
| 10/26-31/21 | 47 | 18 | 12 | 19 | 3 | 0 |
| 8/3-8/21 | 48 | 19 | 15 | 16 | 1 | 0 |
Jan. 6th hearings and documents at Mar-a-Lago
Among registered voters, 55% say they have heard a lot about the hearings of the House Select Committee on Jan. 6th, while 31% have heard a little and 13% have heard nothing at all. These results are hardly different from the results in August, as shown in Table 32.
Table 32: How much have you heard or read about the hearings of the House Select Committee on Jan. 6th? (among registered voters)
| Poll dates | A lot | A little | Nothing at all | Don’t know |
| 10/24-11/1/22 | 55 | 31 | 13 | 0 |
| 8/10-15/22 | 57 | 27 | 15 | 1 |
There has also been virtually no change in opinion of the extent to which former President Donald Trump was responsible for the violence at the Capitol on Jan. 6th, as shown in Table 33.
Table 33: How much responsibility, if any, should Donald Trump bear for the violence of some of his supporters in the United States Capitol on Jan. 6, 2021? (among registered voters)
| Poll dates | A lot | A little | Nothing at all | Don’t know | Refused |
| 10/24-11/1/22 | 48 | 17 | 32 | 1 | 1 |
| 8/10-15/22 | 47 | 19 | 31 | 2 | 2 |
A majority of registered voters, 55%, believe that Trump had top secret and other classified material or national security documents at his home in Mar-a-Lago this past summer, while 27% say they do not believe he had such documents. Table 34 shows the beliefs about these documents by party identification.
Table 34: Do you believe Donald Trump had top secret and other classified material or national security documents at his home in Mar-a-Lago this past summer? Total and by party identification (among registered voters)
| Party ID | Yes | No | Don’t Know | Refused |
| Total | 55 | 27 | 16 | 1 |
| Republican | 27 | 52 | 21 | 0 |
| Independent | 55 | 26 | 18 | 1 |
| Democrat | 88 | 4 | 8 | 0 |
Evaluations of Biden, Baldwin and Trump
In the current survey, 41% approve of the way President Joe Biden is handling his job as president, while 54% disapprove. In early October 42% approved and 55% disapproved. Table 35 shows approval overall and by party identification.
Table 35: Overall, do you approve or disapprove of the way Joe Biden is handling his job as president? Total and by party identification, October 2022 (among registered voters)
| Party ID | Approve | Disapprove | Don’t know | Refused |
| Total | 41 | 54 | 4 | 1 |
| Republican | 3 | 96 | 2 | 0 |
| Independent | 36 | 56 | 7 | 2 |
| Democrat | 90 | 9 | 1 | 0 |
The trend in Biden approval since 2021 is shown in Table 36.
Table 36: Overall, do you approve or disapprove of the way Joe Biden is handling his job as president? (among registered voters)
| Poll dates | Approve | Disapprove | Don’t know | Refused |
| 10/24-11/1/22 | 41 | 54 | 4 | 1 |
| 10/3-9/22 | 42 | 55 | 2 | 1 |
| 9/6-11/22 | 40 | 55 | 4 | 0 |
| 8/10-15/22 | 40 | 55 | 5 | 1 |
| 6/14-20/22 | 40 | 57 | 3 | 0 |
| 4/19-24/22 | 43 | 53 | 3 | 1 |
| 2/22-27/22 | 43 | 52 | 3 | 2 |
| 10/26-31/21 | 43 | 53 | 4 | 1 |
| 8/3-8/21 | 49 | 46 | 4 | 0 |
Senator Tammy Baldwin is seen favorably by 37% and unfavorably by 37%. The recent trend in views of Baldwin is shown in Table 37.
Table 37: Do you have a favorable or unfavorable opinion of Tammy Baldwin or haven’t you heard enough about her yet? (among registered voters)
| Poll dates | Favorable | Unfavorable | Haven’t heard enough | Don’t know | Refused |
| 10/24-11/1/22 | 37 | 37 | 17 | 8 | 1 |
| 10/3-9/22 | 36 | 36 | 19 | 7 | 1 |
| 9/6-11/22 | 37 | 40 | 19 | 4 | 1 |
| 8/10-15/22 | 39 | 37 | 18 | 6 | 0 |
| 6/14-20/22 | 39 | 37 | 20 | 3 | 1 |
| 4/19-24/22 | 43 | 36 | 17 | 3 | 0 |
| 2/22-27/22 | 42 | 36 | 18 | 3 | 1 |
| 10/26-31/21 | 38 | 39 | 19 | 3 | 0 |
| 8/3-8/21 | 40 | 38 | 19 | 3 | 0 |
Table 38 shows opinion of Trump overall and by party identification in the current survey. A large majority of Republicans hold a favorable view of Trump, while majorities of independents and Democrats have an unfavorable opinion of him.
Table 38: Do you have a favorable or unfavorable opinion of Donald Trump or haven’t you heard enough about them yet? Total and by party identification, September 2022 (among registered voters)
| Party ID | Favorable | Unfavorable | Haven’t heard enough | Don’t know | Refused |
| Total | 39 | 53 | 2 | 4 | 2 |
| Republican | 78 | 12 | 3 | 5 | 2 |
| Independent | 35 | 53 | 4 | 6 | 2 |
| Democrat | 4 | 96 | 0 | 0 | 0 |
Views of Trump have barely changed since 2021, as shown in Table 39.
Table 39: Do you have a favorable or unfavorable opinion of Donald Trump or haven’t you heard enough about them yet? (among registered voters)
| Poll dates | Favorable | Unfavorable | Haven’t heard enough | Don’t know | Refused |
| 10/24-11/1/22 | 39 | 53 | 2 | 4 | 2 |
| 10/3-9/22 | 37 | 55 | 2 | 5 | 1 |
| 9/6-11/22 | 38 | 58 | 1 | 3 | 0 |
| 8/10-15/22 | 38 | 57 | 1 | 4 | 0 |
| 6/14-20/22 | 39 | 56 | 3 | 2 | 0 |
| 4/19-24/22 | 36 | 58 | 2 | 3 | 1 |
| 2/22-27/22 | 36 | 57 | 2 | 3 | 2 |
| 10/26-31/21 | 38 | 57 | 2 | 3 | 0 |
| 8/3-8/21 | 38 | 55 | 3 | 4 | 1 |
About the Marquette Law School Poll
The Marquette Law School Poll is the most extensive statewide polling project in Wisconsin history. This poll interviewed 802 registered Wisconsin voters by landline or cell phone from Oct. 24-Nov. 1, 2022. The margin of error is +/-4.6 percentage points for the full sample. The margin of error among 679 likely voters is +/-4.8 percentage points.
Some issue items were asked of half the sample. Those on Form A were asked of 399 and have a margin of error of +/-6.5 percentage points. Form B items were asked of 403 and have a margin of error of +/-6.4 percentage points.
Items asked of half-samples on Form A include concern about the issues of public schools, inflation, taxes, and gun violence. Form B asked concern about the coronavirus pandemic, illegal immigration, and ensuring an accurate vote count. Form B also included an item on property taxes and school spending. Concern about crime and about abortion policy were asked on both Form A and Form B.
The partisan makeup of the sample in this poll, including those who lean to a party, is 46% Republican, 44% Democratic and 9% independent. The partisan makeup of the sample, excluding those who lean to a party, is 30% Republican, 28% Democratic and 41% independent.
Since January 2020, the long-term partisan balance, including those who lean to a party, in the Marquette Law Poll has been 45% Republican and 44 % Democratic, with 9% independent. Partisanship excluding those who lean has been 30% Republican and 28% Democratic, with 41% independent.
The entire questionnaire, methodology statement, full results and breakdowns by demographic groups are available at law.marquette.edu/poll/results-and-data.
Poll datesEversMichelsBeglingerOtherDon’t knowRefused10/24-11/1/224848201010/3-9/22474641119/6-11/22474450308/10-15/2248444021
(b) Registered voters
| Poll dates | Evers | Michels | Beglinger | Other | Don’t know | Refused |
| 10/24-11/1/22 | 44 | 45 | 5 | 0 | 3 | 3 |
| 10/3-9/22 | 46 | 41 | 7 | 1 | 3 | 1 |
| 9/6-11/22 | 44 | 43 | 8 | 1 | 4 | 0 |
| 8/10-15/22 | 45 | 43 | 7 | 0 | 3 | 2 |
Table 2 shows the trend in support for the Senate candidates among likely voters and among registered voters since August.
Table 2: Vote for U.S. Senate
(a) Likely voters
| Poll dates | Barnes | Johnson | Neither | Don’t know | Refused |
| 10/24-11/1/22 | 48 | 50 | 0 | 1 | 1 |
| 10/3-9/22 | 46 | 52 | 1 | 1 | 1 |
| 9/6-11/22 | 48 | 49 | 1 | 1 | 0 |
| 8/10-15/22 | 52 | 45 | 0 | 1 | 1 |
(b) Registered voters
| Poll dates | Barnes | Johnson | Neither | Don’t know | Refused |
| 10/24-11/1/22 | 45 | 48 | 2 | 1 | 3 |
| 10/3-9/22 | 47 | 47 | 4 | 2 | 1 |
| 9/6-11/22 | 47 | 48 | 3 | 3 | 0 |
| 8/10-15/22 | 51 | 44 | 1 | 3 | 1 |
Partisan support for the candidates in the race for governor is shown in Table 3 among likely voters. Both Democratic and Republican voters are strongly unified behind their respective party’s candidates, with 95% of Democrats supporting Evers and 97% of Republicans supporting Michels. Forty-seven percent of independents back Evers, while 46% prefer Michels. The independent candidate, Beglinger, receives 5% from independent voters and 1% from Republicans and 1% from Democrats.
Table 3: Vote for Governor by party identification (among likely voters)
(a) Oct. 24-Nov. 1
| Party ID | Evers | Michels | Beglinger | Don’t know | Refused |
| Republican | 2 | 97 | 1 | 0 | 0 |
| Independent | 47 | 46 | 5 | 1 | 0 |
| Democrat | 95 | 2 | 1 | 1 | 0 |
(b) Oct. 3-9
| Party ID | Evers | Michels | Beglinger | Other | Don’t know | Refused |
| Republican | 6 | 88 | 4 | 0 | 2 | 1 |
| Independent | 43 | 44 | 7 | 1 | 1 | 3 |
| Democrat | 96 | 2 | 1 | 0 | 0 | 0 |
(c) Sept. 6-11
| Party ID | Evers | Michels | Beglinger | Other | Don’t know | Refused |
| Republican | 3 | 92 | 2 | 0 | 3 | 1 |
| Independent | 45 | 39 | 11 | 0 | 5 | 0 |
| Democrat | 95 | 4 | 2 | 0 | 0 | 0 |
(d) Aug. 10-15
| Party ID | Evers | Michels | Beglinger | Other | Don’t know | Refused |
| Republican | 5 | 92 | 2 | 0 | 1 | 0 |
| Independent | 49 | 38 | 7 | 0 | 4 | 2 |
| Democrat | 94 | 2 | 3 | 0 | 0 | 1 |
Partisan support for the U.S. Senate candidates is shown in Table 4 among likely voters. Partisans are strongly aligned with their party’s candidates, with 98% of Democrats supporting Barnes and 97% of Republicans supporting Johnson. Forty-six percent of independents back Barnes, while 53% prefer Johnson. In early October 45% favored Barnes and 51% backed Johnson.
Table 4: Vote for U.S. Senate by party identification (among likely voters)
(a) Oct. 24-Nov. 1
| Party ID | Barnes | Johnson | Neither | Don’t know | Refused |
| Republican | 3 | 97 | 0 | 0 | 0 |
| Independent | 46 | 53 | 1 | 0 | 0 |
| Democrat | 98 | 0 | 0 | 2 | 0 |
(b) Oct. 3-9
| Party ID | Barnes | Johnson | Neither | Don’t know | Refused |
| Republican | 3 | 96 | 0 | 0 | 1 |
| Independent | 45 | 51 | 3 | 1 | 1 |
| Democrat | 93 | 5 | 0 | 2 | 0 |
(c) Sept. 6-11
| Party ID | Barnes | Johnson | Neither | Don’t know | Refused |
| Republican | 2 | 97 | 1 | 0 | 0 |
| Independent | 46 | 48 | 2 | 3 | 0 |
| Democrat | 96 | 4 | 0 | 0 | 0 |
(d) Aug. 10-15
| Party ID | Barnes | Johnson | Neither | Don’t know | Refused |
| Republican | 6 | 94 | 0 | 0 | 0 |
| Independent | 55 | 40 | 0 | 3 | 3 |
| Democrat | 99 | 0 | 0 | 0 | 0 |
Among Republicans, 83% are “likely voters”: that is, they say they are absolutely certain to vote in November’s elections or have already voted. The same is true of 89% of Democrats and 72% of independents. Early voting accounts for some of the Democratic advantage in those percentages, with 10% of Democrats saying they have already voted compared to 3% of Republicans. Those who have already voted are included in the percentages who are certain to vote. Certainty of voting by party is shown in Table 5; those who have already voted are included in the percentages who are “absolutely certain” to vote. In early October, Republicans were slightly more likely than Democrats to say they were certain to vote.
Table 5: What are the chances that you will vote in the November 2022 general election for governor, Congress, and other offices – are you absolutely certain to vote, very likely to vote, are the chances 50-50, or don’t you think you will vote? (“Absolutely certain” includes those who have already voted) by party identification
(a) Oct. 24-Nov. 1
| Party ID | Absolutely certain | Very likely | 50-50 | Will not vote | Refused |
| Republican | 83 | 10 | 5 | 2 | 0 |
| Independent | 72 | 13 | 9 | 6 | 1 |
| Democrat | 89 | 5 | 2 | 3 | 0 |
(b) Oct. 3-9
| Party ID | Absolutely certain | Very likely | 50-50 | Will not vote |
| Republican | 84 | 11 | 4 | 1 |
| Independent | 69 | 17 | 11 | 3 |
| Democrat | 83 | 10 | 7 | 0 |
(c) Sept. 6-11
| Party ID | Absolutely certain | Very likely | 50-50 | Will not vote |
| Republican | 77 | 16 | 3 | 3 |
| Independent | 71 | 13 | 12 | 3 |
| Democrat | 80 | 12 | 7 | 0 |
(d) Aug. 10-15
| Party ID | Absolutely certain | Very likely | 50-50 | Will not vote |
| Republican | 83 | 11 | 4 | 2 |
| Independent | 66 | 16 | 14 | 3 |
| Democrat | 82 | 8 | 5 | 5 |
The effect of different levels of turnout on the vote for governor is shown in Table 6. The first row shows preference among all registered voters, while the second row shows the results for an electorate composed of those either “absolutely certain” to vote or “very likely” to vote. The third row shows the results among only the most likely voters: those who say they are “absolutely certain” to vote. (As explained above and consistently with past practice, this last group constitutes “likely voters” in this release.)
Table 6: Vote for Governor by certainty of voting
| How likely to vote | Evers | Michels | Beglinger | Other | Don’t know |
| All registered voters | 44 | 45 | 5 | 0 | 3 |
| Absolutely certain or very likely to vote | 47 | 47 | 4 | 0 | 2 |
| Absolutely certain to vote only | 48 | 48 | 2 | 0 | 1 |
The vote preferences of those less than certain to vote differ from the preferences among those certain to vote, which also affects the difference in vote margin between “likely voters” and all registered voters. Table 7 shows vote for governor comparing those absolutely certain to vote (“likely voters”) and those who say they are not certain to vote. Those less than certain to vote support Michels over Evers but are also much more likely to choose the independent candidate, to say they don’t know or to refuse to say.
Table 7: Vote for governor by whether people are certain or less than certain to vote
| Certainty of voting | Evers | Michels | Beglinger | Other | Don’t know | Refused |
| Absolutely certain | 48 | 48 | 2 | 0 | 1 | 0 |
| Less than certain | 31 | 34 | 16 | 0 | 11 | 9 |
Table 8 shows the vote for U.S. Senate by certainty of voting.
Table 8: Vote for U.S. Senate by certainty of voting
| How likely to vote | Barnes | Johnson | Neither | Don’t know |
| All registered voters | 45 | 48 | 2 | 1 |
| Absolutely certain or very likely to vote | 48 | 49 | 1 | 1 |
| Absolutely certain to vote only | 48 | 50 | 0 | 1 |
Table 9 shows vote preference for Senate comparing those who say they are absolutely certain to vote and those who say they are not. As with the vote for governor, the less likely give an edge to the Republican, Johnson, although those less likely to vote are also far more likely to not favor either candidate than are those absolutely certain to vote.
Table 9: Vote for U.S. Senate by whether people are certain or less than certain to vote
| Certainty of voting | Barnes | Johnson | Neither | Don’t know | Refused |
| Absolutely certain | 48 | 50 | 0 | 1 | 1 |
| Less than certain | 33 | 43 | 8 | 4 | 11 |
Those who are not certain to vote are much less enthusiastic about voting and pay less attention to politics than are those certain to vote, as shown in Table 10 (a) and Table 10 (b).
Table 10: Enthusiasm and attention to politics by certainty of voting
(a) How enthusiastic are you about voting in the elections this November for governor, senator, and other offices?
| Certainty of voting | Very | Somewhat | Not too | Not at all | Don’t know | Refused |
| Absolutely certain | 79 | 13 | 3 | 4 | 1 | 0 |
| Less than certain | 11 | 41 | 13 | 33 | 2 | 0 |
(b) Some people seem to follow what’s going on in politics most of the time, whether there’s an election going on or not. Others aren’t that interested. Would you say you follow what’s going on in politics …?
| Certainty of voting | Most of the time | Some of the time | Only now and then | Hardly at all | Refused |
| Absolutely certain | 77 | 19 | 3 | 1 | 0 |
| Less than certain | 36 | 17 | 24 | 23 | 0 |
Perceived candidate traits
Table 11 shows the favorable and unfavorable ratings of the candidates among all registered voters since June, along with those who say they haven’t heard enough or don’t know.
The non-incumbents have become substantially better known following their primary victories on Aug. 9, although they remain less well known than the incumbents.
Table 11: Do you have a favorable or unfavorable opinion of [INSERT NAME] or haven’t you heard enough about them yet? (among registered voters)
(a) Evers
| Poll dates | Favorable | Unfavorable | Haven’t heard enough | Don’t know | Refused |
| 10/24-11/1/22 | 44 | 46 | 6 | 3 | 1 |
| 10/3-9/22 | 44 | 46 | 6 | 3 | 1 |
| 9/6-11/22 | 45 | 45 | 7 | 3 | 0 |
| 8/10-15/22 | 46 | 41 | 6 | 6 | 0 |
| 6/14-20/22 | 44 | 42 | 11 | 2 | 0 |
(b) Michels
| Poll dates | Favorable | Unfavorable | Haven’t heard enough | Don’t know | Refused |
| 10/24-11/1/22 | 39 | 39 | 16 | 5 | 1 |
| 10/3-9/22 | 36 | 36 | 20 | 7 | 1 |
| 9/6-11/22 | 34 | 39 | 19 | 8 | 1 |
| 8/10-15/22 | 33 | 33 | 24 | 10 | 0 |
| 6/14-20/22 | 22 | 22 | 51 | 5 | 0 |
(c) Beglinger
| Poll dates | Favorable | Unfavorable | Haven’t heard enough | Don’t know | Refused |
| 10/24-11/1/22 | 1 | 3 | 63 | 31 | 1 |
| 10/3-9/22 | 1 | 6 | 66 | 26 | 1 |
| 9/6-11/22 | 3 | 6 | 63 | 28 | 0 |
(d) Barnes
| Poll dates | Favorable | Unfavorable | Haven’t heard enough | Don’t know | Refused |
| 10/24-11/1/22 | 40 | 44 | 11 | 4 | 1 |
| 10/3-9/22 | 39 | 40 | 15 | 6 | 0 |
| 9/6-11/22 | 33 | 32 | 25 | 9 | 1 |
| 8/10-15/22 | 37 | 22 | 30 | 11 | 0 |
| 6/14-20/22 | 21 | 16 | 57 | 6 | 0 |
(e) Johnson
| Poll dates | Favorable | Unfavorable | Haven’t heard enough | Don’t know | Refused |
| 10/24-11/1/22 | 43 | 46 | 7 | 3 | 1 |
| 10/3-9/22 | 41 | 45 | 9 | 4 | 1 |
| 9/6-11/22 | 39 | 47 | 11 | 3 | 1 |
| 8/10-15/22 | 38 | 47 | 9 | 6 | 0 |
| 6/14-20/22 | 37 | 46 | 14 | 2 | 0 |
Table 12 shows the perceptions of which candidates better understand the problems of ordinary people in Wisconsin over the course of the fall campaign.
Table 12: Who do you think better understands the problems faced by ordinary people in Wisconsin, …? (among registered voters)
(a) … Tony Evers or Tim Michels?
| Poll dates | Tony Evers | Tim Michels | Both | Neither | Don’t know | Refused |
| 10/24-11/1/22 | 48 | 44 | 0 | 2 | 5 | 1 |
| 10/3-9/22 | 47 | 39 | 0 | 5 | 7 | 0 |
| 9/6-11/22 | 47 | 41 | 0 | 4 | 7 | 0 |
(b) … Mandela Barnes or Ron Johnson?
| Poll dates | Mandela Barnes | Ron Johnson | Both | Neither | Don’t know | Refused |
| 10/24-11/1/22 | 44 | 45 | 0 | 2 | 7 | 1 |
| 10/3-9/22 | 47 | 40 | 1 | 5 | 8 | 0 |
| 9/6-11/22 | 44 | 40 | 1 | 6 | 9 | 0 |
Table 13 shows the perception that candidates “share my values.” There has been some increase in the percentage of those polled who say the candidates “don’t share my values,” with less change in the percentage perceiving shared values. These shifts are somewhat larger for the non-incumbent candidates, Michels and Barnes, who were less well known at the beginning of the fall campaign.
Table 13: For each of the following candidates, would you say they are someone who shares your values or don’t they share your values? (among registered voters)
| Candidate | Poll dates | Shares values | Doesn’t share values | Don’t know |
| Evers | 10/24-11/1/22 | 48 | 46 | 6 |
| Evers | 10/3-9/22 | 48 | 47 | 5 |
| Evers | 9/6-11/22 | 47 | 48 | 5 |
| Evers | 8/10-15/22 | 50 | 41 | 9 |
| Michels | 10/24-11/1/22 | 41 | 47 | 11 |
| Michels | 10/3-9/22 | 43 | 45 | 12 |
| Michels | 9/6-11/22 | 41 | 47 | 11 |
| Michels | 8/10-15/22 | 38 | 38 | 23 |
| Barnes | 10/24-11/1/22 | 44 | 46 | 9 |
| Barnes | 10/3-9/22 | 44 | 44 | 12 |
| Barnes | 9/6-11/22 | 44 | 41 | 15 |
| Barnes | 8/10-15/22 | 45 | 31 | 24 |
| Johnson | 10/24-11/1/22 | 44 | 49 | 7 |
| Johnson | 10/3-9/22 | 46 | 47 | 7 |
| Johnson | 9/6-11/22 | 42 | 51 | 7 |
| Johnson | 8/10-15/22 | 40 | 50 | 10 |
Table 14 shows the perception that candidates “care about people like you.” The images of the challengers, Michels and Barnes, have seen shifts with fewer saying they don’t know enough and increases in the percent saying a candidate “doesn’t care,” while the percent saying “cares” has changed little. The images of the two incumbents, Evers and Johnson, have barely shifted since August.
Table 14: For each of the following candidates, would you say they are someone who cares about people like you, or don’t they care about people like you? (among registered voters)
| Candidate | Poll dates | Cares | Doesn’t care | Don’t know |
| Evers | 10/24-11/1/22 | 52 | 40 | 8 |
| Evers | 8/10-15/22 | 54 | 38 | 9 |
| Michels | 10/24-11/1/22 | 43 | 46 | 11 |
| Michels | 8/10-15/22 | 38 | 38 | 23 |
| Barnes | 10/24-11/1/22 | 49 | 42 | 8 |
| Barnes | 8/10-15/22 | 50 | 27 | 23 |
| Johnson | 10/24-11/1/22 | 43 | 49 | 7 |
| Johnson | 8/10-15/22 | 41 | 49 | 10 |
Evers job approval
Table 15 shows approval since Feb. 2022 of how Evers has handled his job as governor. After declining net approval for much of the year, there have been slight upturns in the last two polls, with approval at 46% and disapproval at 47% in the latest survey.
Table 15: Overall, do you approve or disapprove of the way Tony Evers is handling his job as Governor of Wisconsin? (among registered voters)
| Poll dates | Net approval | Approve | Disapprove | Don’t know | Refused |
| 10/24-11/1/22 | -1 | 46 | 47 | 6 | 2 |
| 10/3-9/22 | -2 | 46 | 48 | 5 | 1 |
| 9/6-11/22 | -3 | 44 | 47 | 8 | 0 |
| 8/10-15/22 | 2 | 47 | 45 | 8 | 1 |
| 6/14-20/22 | 3 | 48 | 45 | 6 | 1 |
| 4/19-24/22 | 6 | 49 | 43 | 7 | 1 |
| 2/22-27/22 | 9 | 50 | 41 | 8 | 1 |
Important issues
In each Marquette Law School poll since August 2021, respondents have been asked to rate how concerned they are with a variety of issues. Table 16 shows the concern with nine issues in the current survey, sorted from highest to lowest percent saying they are “very concerned.”
Table 16: How concerned are you about each of the following? Are you very concerned, somewhat concerned, not too concerned, or not at all concerned with … (among registered voters)
| Issue | Very concerned | Somewhat concerned | Not too concerned | Not at all concerned |
| Inflation | 68 | 24 | 6 | 2 |
| Public Schools | 62 | 28 | 5 | 5 |
| Crime | 57 | 28 | 11 | 3 |
| Gun violence | 56 | 25 | 10 | 7 |
| Accurate vote count | 56 | 17 | 13 | 13 |
| Abortion policy | 52 | 26 | 9 | 9 |
| Taxes | 48 | 36 | 12 | 3 |
| Illegal immigration | 40 | 29 | 16 | 15 |
| Coronavirus | 16 | 36 | 22 | 26 |
Inflation ranks as the top issue concern in this poll. After peaking in June, concern about inflation has been slightly lower since then but remains atop the list.
Table 17: Concern about inflation, Aug. 2021-Oct. 2022 (among registered voters)
| Poll dates | Very concerned | Somewhat concerned | Not too concerned | Not at all concerned |
| 10/24-11/1/22 | 68 | 24 | 6 | 2 |
| 10/3-9/22 | 68 | 25 | 5 | 1 |
| 9/6-11/22 | 70 | 24 | 5 | 2 |
| 8/10-15/22 | 67 | 27 | 4 | 0 |
| 6/14-20/22 | 75 | 20 | 4 | 1 |
| 4/19-24/22 | 69 | 23 | 6 | 1 |
| 2/22-27/22 | 68 | 28 | 3 | 1 |
| 10/26-31/21 | 64 | 28 | 6 | 1 |
| 8/3-8/21 | 49 | 35 | 11 | 3 |
Partisans differ substantially in their concern over particular issues, as shown in Table 18. Panel (a) is sorted by Republican concern. Panel (b) is sorted by concern among Democrats. Panel (c) is sorted by concern among independents. The entries are the percent of each partisan group who say they are “very concerned” about the issue. Republicans and Democrats have different top concerns—an accurate vote count and inflation for Republicans, and abortion policy and gun violence for Democrats—while independents put inflation and public schools as their top concerns.
Table 18: Issue concerns by party identification, percent “very concerned” (among registered voters)
(a) Sorted by concern among Republicans
| Issue | Republican | Independent | Democrat |
| Accurate vote count | 81 | 50 | 38 |
| Inflation | 80 | 78 | 38 |
| Crime | 79 | 55 | 37 |
| Illegal immigration | 71 | 38 | 9 |
| Taxes | 62 | 54 | 21 |
| Public schools | 58 | 64 | 62 |
| Gun violence | 44 | 53 | 76 |
| Abortion policy | 33 | 47 | 81 |
| Coronavirus | 8 | 14 | 21 |
(b) Sorted by concern among Democrats
| Issue | Republican | Independent | Democrat |
| Abortion policy | 33 | 47 | 81 |
| Gun violence | 44 | 53 | 76 |
| Public schools | 58 | 64 | 62 |
| Accurate vote count | 81 | 50 | 38 |
| Inflation | 80 | 78 | 38 |
| Crime | 79 | 55 | 37 |
| Coronavirus | 8 | 14 | 21 |
| Taxes | 62 | 54 | 21 |
| Illegal immigration | 71 | 38 | 9 |
(c) Sorted by concern among Independents
| Issue | Republican | Independent | Democrat |
| Inflation | 80 | 78 | 38 |
| Public schools | 58 | 64 | 62 |
| Crime | 79 | 55 | 37 |
| Taxes | 62 | 54 | 21 |
| Gun violence | 44 | 53 | 76 |
| Accurate vote count | 81 | 50 | 38 |
| Abortion policy | 33 | 47 | 81 |
| Illegal immigration | 71 | 38 | 9 |
| Coronavirus | 8 | 14 | 21 |
Abortion
Awareness of the Supreme Court’s decision in June that overturned Roe v. Wade remains quite high. Seventy-eight percent say they have heard a lot about the decision, 19% have heard a little and 2% have heard nothing at all. Awareness has changed little since August, when 79% had heard a lot, 17% had heard a little and 3% had heard nothing at all. Table 19 shows attention to the decision by party identification in the current poll.
Table 19: How much have you heard or read about a recent United States Supreme Court decision on abortion? total and by party identification (among registered voters)
| Party ID | A lot | A little | Nothing at all | Don’t know |
| Total | 78 | 19 | 2 | 0 |
| Republican | 75 | 22 | 3 | 0 |
| Independent | 77 | 20 | 2 | 0 |
| Democrat | 85 | 14 | 1 | 0 |
The decision to overturn Roe v. Wade is opposed by a majority of Wisconsin registered voters, including majorities of independents and Democrats, while it is favored by a majority of Republicans in the state, as shown in Table 20.
Table 20: Do you favor or oppose the recent Supreme Court decision to overturn Roe versus Wade, thus striking down the 1973 decision that made abortion legal in all 50 states? Total and by party identification (among registered voters)
(a) Oct. 24-Nov. 1
| Party ID | Favor | Oppose | Haven’t heard of decision | Don’t Know | Refused |
| Total | 37 | 55 | 0 | 6 | 2 |
| Republican | 72 | 22 | 0 | 5 | 1 |
| Independent | 35 | 52 | 1 | 9 | 3 |
| Democrat | 4 | 92 | 0 | 2 | 1 |
(b) Oct. 3-9
| Party ID | Favor | Oppose | Haven’t heard of decision | Don’t Know | Refused |
| Total | 33 | 60 | 1 | 4 | 2 |
| Republican | 61 | 32 | 1 | 3 | 3 |
| Independent | 30 | 60 | 1 | 6 | 2 |
| Democrat | 7 | 89 | 1 | 3 | 0 |
(c) Sept. 6-11
| Party ID | Favor | Oppose | Haven’t heard of decision | Don’t Know | Refused |
| Total | 30 | 63 | 0 | 5 | 2 |
| Republican | 59 | 29 | 0 | 8 | 4 |
| Independent | 28 | 66 | 0 | 5 | 1 |
| Democrat | 3 | 95 | 0 | 2 | 0 |
(d) Aug. 10-15
| Party ID | Favor | Oppose | Haven’t heard of decision | Don’t Know | Refused |
| Total | 33 | 60 | 1 | 4 | 2 |
| Republican | 62 | 28 | 0 | 8 | 2 |
| Independent | 31 | 62 | 2 | 2 | 3 |
| Democrat | 5 | 92 | 0 | 2 | 1 |
The respondents overwhelmingly support allowing legal abortions in the case of rape or incest. Support within each partisan group is 70% or more, as shown in Table 21.
Table 21: Do you think Wisconsin should or should not allow a woman to obtain a legal abortion if she became pregnant as the result of rape or incest? Total and by party identification (among registered voters)
(a) Oct. 24-Nov. 1
| Party ID | Should allow | Should not allow | Don’t Know | Refused |
| Total | 84 | 10 | 4 | 2 |
| Republican | 73 | 21 | 4 | 2 |
| Independent | 83 | 8 | 5 | 4 |
| Democrat | 97 | 3 | 1 | 0 |
(b) Oct. 3-9
| Party ID | Should allow | Should not allow | Don’t Know | Refused |
| Total | 83 | 11 | 4 | 2 |
| Republican | 72 | 19 | 7 | 2 |
| Independent | 83 | 9 | 5 | 3 |
| Democrat | 95 | 4 | 0 | 1 |
(c) Sept. 6-11
| Party ID | Should allow | Should not allow | Don’t Know | Refused |
| Total | 83 | 10 | 5 | 2 |
| Republican | 70 | 20 | 8 | 3 |
| Independent | 83 | 9 | 6 | 2 |
| Democrat | 96 | 2 | 2 | 0 |
Schools
If asked to choose between increasing state support for students to attend private schools or increasing funding for public schools, 29% favor more money for private school students while 63% prefer more state money go to public schools. Views on this issue differ by party identification, as shown in Table 22.
Table 22: If you were making the choice for the next Wisconsin state budget between increasing state support for students to attend private schools or increasing state support for public schools, which would you favor, private schools or public schools? total and by party identification (among registered voters)
| Party ID | Private schools | Public schools | Both equally (VOL) | Neither (VOL) | Don’t know |
| Total | 29 | 63 | 3 | 1 | 3 |
| Republican | 49 | 40 | 1 | 2 | 6 |
| Independent | 30 | 62 | 3 | 1 | 3 |
| Democrat | 7 | 90 | 2 | 0 | 1 |
Forty-six percent of registered voters say it is more important to reduce property taxes when compared to increasing spending on public schools, while 48% say it is more important to increase spending on public schools. When asked in early October, 42% said reduce property taxes and 52% said increase spending on public schools. Table 23 shows the partisan divide on support for property tax cuts vs. spending on schools in the current survey.
Table 23: Which is more important to you: reduce property taxes or increase spending on public schools? Total and by party identification (among registered voters)
| Party ID | Reducing property taxes | Increasing spending on public schools | Don’t know | Refused |
| Total | 46 | 48 | 5 | 1 |
| Republican | 72 | 20 | 8 | 1 |
| Independent | 47 | 48 | 3 | 1 |
| Democrat | 16 | 80 | 4 | 0 |
Opinion on the choice between reducing property taxes and increasing funding for public schools has varied substantially over time. There had been more concern about property taxes prior to 2015, when support for school funding surged. The gap between the two options has narrowed since 2020, as shown in Table 24
Table 24: Which is more important to you: reduce property taxes or increase spending on public schools? (among registered voters)
| Poll dates | Reducing property taxes | Increasing spending on public schools | Don’t know | Refused |
| 10/24-11/1/22 | 46 | 48 | 5 | 1 |
| 10/3-9/22 | 42 | 52 | 5 | 0 |
| 9/6-11/22 | 41 | 51 | 5 | 3 |
| 8/10-15/22 | 43 | 52 | 5 | 0 |
| 4/19-24/22 | 46 | 50 | 4 | 0 |
| 8/3-8/21 | 42 | 52 | 5 | 1 |
| 2/19-23/20 | 38 | 56 | 5 | 1 |
| 1/8-12/20 | 41 | 55 | 4 | 1 |
| 1/16-20/19 | 39 | 55 | 6 | 0 |
| 10/24-28/18 | 40 | 55 | 4 | 1 |
| 10/3-7/18 | 37 | 57 | 6 | 1 |
| 9/12-16/18 | 38 | 57 | 5 | 0 |
| 8/15-19/18 | 32 | 61 | 5 | 1 |
| 6/13-17/18 | 35 | 59 | 5 | 0 |
| 2/25-3/1/18 | 33 | 63 | 3 | 1 |
| 4/7-10/15 | 40 | 54 | 5 | 1 |
| 5/6-9/13 | 49 | 46 | 4 | 1 |
| 3/11-13/13 | 49 | 46 | 4 | 1 |
State funding for police
There is very high support for the state to increase funding for police, with 78% in favor of more state aid for police while 15% are opposed. Majorities of each partisan group support an increase in state support for police.
Table 25: Do you favor or oppose increasing state funding for local police in Wisconsin? Total and by party identification (among registered voters)
| Party ID | Favor | Oppose | Don’t Know | Refused |
| Total | 78 | 15 | 6 | 2 |
| Republican | 95 | 2 | 3 | 1 |
| Independent | 80 | 12 | 7 | 1 |
| Democrat | 58 | 32 | 7 | 3 |
Parental leave
A majority, 73%, favor requiring businesses to provide paid leave for new parents, while 18% are opposed. In August, 78% favored this and 17% were opposed. Majorities of each partisan group favor a parental leave policy, as shown in Table 26.
Table 26: Do you favor or oppose a proposal that would require businesses to provide paid family leave for mothers and fathers of new babies? Total and by party identification (among registered voters)
| Party ID | Favor | Oppose | Don’t Know | Refused |
| Total | 73 | 18 | 8 | 2 |
| Republican | 62 | 26 | 10 | 2 |
| Independent | 65 | 23 | 10 | 2 |
| Democrat | 95 | 3 | 2 | 0 |
Direction of state and family financial situation
A majority of respondents, 58%, think the state is off on the wrong track, while 34% say it is headed in the right direction. The trend since 2020 is shown in Table 27.
Table 27: Thinking just about the state of Wisconsin, do you feel things in Wisconsin are generally going in the right direction, or do you feel things have gotten off on the wrong track? (among registered voters)
| Poll dates | Right direction | Wrong track | Don’t know | Refused |
| 10/24-11/1/22 | 34 | 58 | 8 | 1 |
| 10/3-9/22 | 31 | 63 | 6 | 0 |
| 9/6-11/22 | 40 | 53 | 7 | 1 |
| 8/10-15/22 | 35 | 56 | 9 | 0 |
| 6/14-20/22 | 37 | 56 | 6 | 0 |
| 4/19-24/22 | 36 | 56 | 7 | 0 |
| 2/22-27/22 | 39 | 53 | 8 | 1 |
| 10/26-31/21 | 41 | 51 | 7 | 1 |
| 8/3-8/21 | 39 | 52 | 9 | 0 |
| 3/24-29/20 | 61 | 30 | 9 | 1 |
| 2/19-23/20 | 52 | 39 | 8 | 0 |
| 1/8-12/20 | 46 | 47 | 6 | 1 |
The percentage saying their family is “living comfortably” has declined since 2020, while percentages of those “just getting by” and “struggling” have risen, as shown in Table 28.
Table 28: Thinking about your family’s financial situation, would you say you are living comfortably, just getting by, or struggling to make ends meet? (among registered voters)
| Poll dates | Living comfortably | Just getting by | Struggling | Don’t know | Refused |
| 10/24-11/1/22 | 50 | 38 | 10 | 0 | 1 |
| 10/3-9/22 | 53 | 35 | 11 | 1 | 0 |
| 9/6-11/22 | 56 | 33 | 11 | 0 | 0 |
| 8/10-15/22 | 54 | 36 | 10 | 0 | 1 |
| 8/3-8/21 | 60 | 31 | 7 | 0 | 1 |
| 10/21-25/20 | 67 | 26 | 6 | 0 | 1 |
| 9/30-10/4/20 | 60 | 30 | 9 | 1 | 1 |
| 8/30-9/3/20 | 60 | 32 | 8 | 0 | 1 |
| 8/4-9/20 | 63 | 28 | 8 | 1 | 0 |
| 6/14-18/20 | 61 | 31 | 6 | 1 | 1 |
| 5/3-7/20 | 61 | 28 | 9 | 0 | 1 |
| 3/24-29/20 | 59 | 30 | 10 | 0 | 0 |
| 2/19-23/20 | 62 | 29 | 8 | 0 | 1 |
| 1/8-12/20 | 63 | 28 | 8 | 0 | 0 |
| 12/3-8/19 | 62 | 27 | 11 | 1 | 1 |
| 11/13-17/19 | 66 | 25 | 8 | 0 | 1 |
| 8/25-29/19 | 59 | 30 | 9 | 1 | 0 |
| 4/3-7/19 | 59 | 31 | 9 | 0 | 0 |
| 1/16-20/19 | 60 | 30 | 9 | 1 | 0 |
| 10/24-28/18 | 60 | 30 | 9 | 0 | 1 |
| 10/3-7/18 | 63 | 29 | 7 | 0 | 0 |
| 9/12-16/18 | 56 | 32 | 12 | 1 | 0 |
| 8/15-19/18 | 63 | 28 | 9 | 0 | 0 |
| 6/13-17/18 | 58 | 30 | 11 | 1 | 1 |
| 2/25-3/1/18 | 54 | 34 | 10 | 1 | 0 |
| 6/22-25/17 | 53 | 32 | 14 | 1 | 0 |
| 3/13-16/17 | 54 | 35 | 11 | 1 | 0 |
| 10/26-31/16 | 50 | 35 | 14 | 0 | 1 |
| 10/6-9/16 | 47 | 38 | 15 | 0 | 0 |
| 9/15-18/16 | 53 | 34 | 11 | 1 | 1 |
| 8/25-28/16 | 53 | 33 | 13 | 0 | 0 |
| 6/9-12/16 | 50 | 37 | 12 | 0 | 0 |
| 3/24-28/16 | 51 | 38 | 10 | 1 | 0 |
Confidence in the 2022 and 2020 elections
Voters express more confidence that votes in this November’s election will be accurately cast and counted than they do, looking back, for the 2020 presidential election. Among registered voters 77% say they are very or somewhat confident and 20% say they are not too confident or not at all confident the upcoming election results will be accurate. The breakdown by party is shown in Table 29.
Table 29: How confident are you that, here in Wisconsin, the votes in this November’s election will be accurately cast and counted? Total and by party identification (among registered voters)
| Party ID | Very confident | Somewhat confident | Not too confident | Not at all confident | Don’t know | Refused |
| Total | 45 | 32 | 12 | 8 | 2 | 2 |
| Republican | 20 | 43 | 23 | 10 | 3 | 1 |
| Independent | 42 | 32 | 11 | 12 | 1 | 1 |
| Democrat | 76 | 21 | 1 | 0 | 0 | 2 |
Opinion on the accuracy of the results of the 2020 presidential election continues to sharply divide the public, with 65% saying they are very or somewhat confident and 33% saying they are not too confident or not at all confident in the election result. These views overall and by party identification are shown in Table 30.
Table 30: How confident are you that, here in Wisconsin, the votes for president were accurately cast and counted in the 2020 election? Total and by party identification (among registered voters)
| Party ID | Very confident | Somewhat confident | Not too confident | Not at all confident | Don’t know | Refused |
| Total | 46 | 19 | 14 | 19 | 3 | 1 |
| Republican | 12 | 26 | 27 | 33 | 0 | 1 |
| Independent | 45 | 16 | 13 | 21 | 6 | 0 |
| Democrat | 85 | 13 | 0 | 0 | 1 | 0 |
Table 31 shows the trend in 2020 election confidence.
Table 31: How confident are you that, here in Wisconsin, the votes for president were accurately cast and counted in the 2020 election? (among registered voters)
| Poll dates | Very confident | Somewhat confident | Not too confident | Not at all confident | Don’t know | Refused |
| 10/24-11/1/22 | 46 | 19 | 14 | 19 | 3 | 1 |
| 10/3-9/22 | 48 | 15 | 15 | 19 | 3 | 0 |
| 9/6-11/22 | 46 | 19 | 16 | 18 | 1 | 0 |
| 8/10-15/22 | 48 | 18 | 15 | 17 | 2 | 1 |
| 6/14-20/22 | 51 | 16 | 11 | 21 | 0 | 0 |
| 4/19-24/22 | 48 | 16 | 12 | 23 | 1 | 0 |
| 2/22-27/22 | 48 | 19 | 11 | 19 | 2 | 0 |
| 10/26-31/21 | 47 | 18 | 12 | 19 | 3 | 0 |
| 8/3-8/21 | 48 | 19 | 15 | 16 | 1 | 0 |
Jan. 6th hearings and documents at Mar-a-Lago
Among registered voters, 55% say they have heard a lot about the hearings of the House Select Committee on Jan. 6th, while 31% have heard a little and 13% have heard nothing at all. These results are hardly different from the results in August, as shown in Table 32.
Table 32: How much have you heard or read about the hearings of the House Select Committee on Jan. 6th? (among registered voters)
| Poll dates | A lot | A little | Nothing at all | Don’t know |
| 10/24-11/1/22 | 55 | 31 | 13 | 0 |
| 8/10-15/22 | 57 | 27 | 15 | 1 |
There has also been virtually no change in opinion of the extent to which former President Donald Trump was responsible for the violence at the Capitol on Jan. 6th, as shown in Table 33.
Table 33: How much responsibility, if any, should Donald Trump bear for the violence of some of his supporters in the United States Capitol on Jan. 6, 2021? (among registered voters)
| Poll dates | A lot | A little | Nothing at all | Don’t know | Refused |
| 10/24-11/1/22 | 48 | 17 | 32 | 1 | 1 |
| 8/10-15/22 | 47 | 19 | 31 | 2 | 2 |
A majority of registered voters, 55%, believe that Trump had top secret and other classified material or national security documents at his home in Mar-a-Lago this past summer, while 27% say they do not believe he had such documents. Table 34 shows the beliefs about these documents by party identification.
Table 34: Do you believe Donald Trump had top secret and other classified material or national security documents at his home in Mar-a-Lago this past summer? Total and by party identification (among registered voters)
| Party ID | Yes | No | Don’t Know | Refused |
| Total | 55 | 27 | 16 | 1 |
| Republican | 27 | 52 | 21 | 0 |
| Independent | 55 | 26 | 18 | 1 |
| Democrat | 88 | 4 | 8 | 0 |
Evaluations of Biden, Baldwin and Trump
In the current survey, 41% approve of the way President Joe Biden is handling his job as president, while 54% disapprove. In early October 42% approved and 55% disapproved. Table 35 shows approval overall and by party identification.
Table 35: Overall, do you approve or disapprove of the way Joe Biden is handling his job as president? Total and by party identification, October 2022 (among registered voters)
| Party ID | Approve | Disapprove | Don’t know | Refused |
| Total | 41 | 54 | 4 | 1 |
| Republican | 3 | 96 | 2 | 0 |
| Independent | 36 | 56 | 7 | 2 |
| Democrat | 90 | 9 | 1 | 0 |
The trend in Biden approval since 2021 is shown in Table 36.
Table 36: Overall, do you approve or disapprove of the way Joe Biden is handling his job as president? (among registered voters)
| Poll dates | Approve | Disapprove | Don’t know | Refused |
| 10/24-11/1/22 | 41 | 54 | 4 | 1 |
| 10/3-9/22 | 42 | 55 | 2 | 1 |
| 9/6-11/22 | 40 | 55 | 4 | 0 |
| 8/10-15/22 | 40 | 55 | 5 | 1 |
| 6/14-20/22 | 40 | 57 | 3 | 0 |
| 4/19-24/22 | 43 | 53 | 3 | 1 |
| 2/22-27/22 | 43 | 52 | 3 | 2 |
| 10/26-31/21 | 43 | 53 | 4 | 1 |
| 8/3-8/21 | 49 | 46 | 4 | 0 |
Senator Tammy Baldwin is seen favorably by 37% and unfavorably by 37%. The recent trend in views of Baldwin is shown in Table 37.
Table 37: Do you have a favorable or unfavorable opinion of Tammy Baldwin or haven’t you heard enough about her yet? (among registered voters)
| Poll dates | Favorable | Unfavorable | Haven’t heard enough | Don’t know | Refused |
| 10/24-11/1/22 | 37 | 37 | 17 | 8 | 1 |
| 10/3-9/22 | 36 | 36 | 19 | 7 | 1 |
| 9/6-11/22 | 37 | 40 | 19 | 4 | 1 |
| 8/10-15/22 | 39 | 37 | 18 | 6 | 0 |
| 6/14-20/22 | 39 | 37 | 20 | 3 | 1 |
| 4/19-24/22 | 43 | 36 | 17 | 3 | 0 |
| 2/22-27/22 | 42 | 36 | 18 | 3 | 1 |
| 10/26-31/21 | 38 | 39 | 19 | 3 | 0 |
| 8/3-8/21 | 40 | 38 | 19 | 3 | 0 |
Table 38 shows opinion of Trump overall and by party identification in the current survey. A large majority of Republicans hold a favorable view of Trump, while majorities of independents and Democrats have an unfavorable opinion of him.
Table 38: Do you have a favorable or unfavorable opinion of Donald Trump or haven’t you heard enough about them yet? Total and by party identification, September 2022 (among registered voters)
| Party ID | Favorable | Unfavorable | Haven’t heard enough | Don’t know | Refused |
| Total | 39 | 53 | 2 | 4 | 2 |
| Republican | 78 | 12 | 3 | 5 | 2 |
| Independent | 35 | 53 | 4 | 6 | 2 |
| Democrat | 4 | 96 | 0 | 0 | 0 |
Views of Trump have barely changed since 2021, as shown in Table 39.
Table 39: Do you have a favorable or unfavorable opinion of Donald Trump or haven’t you heard enough about them yet? (among registered voters)
| Poll dates | Favorable | Unfavorable | Haven’t heard enough | Don’t know | Refused |
| 10/24-11/1/22 | 39 | 53 | 2 | 4 | 2 |
| 10/3-9/22 | 37 | 55 | 2 | 5 | 1 |
| 9/6-11/22 | 38 | 58 | 1 | 3 | 0 |
| 8/10-15/22 | 38 | 57 | 1 | 4 | 0 |
| 6/14-20/22 | 39 | 56 | 3 | 2 | 0 |
| 4/19-24/22 | 36 | 58 | 2 | 3 | 1 |
| 2/22-27/22 | 36 | 57 | 2 | 3 | 2 |
| 10/26-31/21 | 38 | 57 | 2 | 3 | 0 |
| 8/3-8/21 | 38 | 55 | 3 | 4 | 1 |
About the Marquette Law School Poll
The Marquette Law School Poll is the most extensive statewide polling project in Wisconsin history. This poll interviewed 802 registered Wisconsin voters by landline or cell phone from Oct. 24-Nov. 1, 2022. The margin of error is +/-4.6 percentage points for the full sample. The margin of error among 679 likely voters is +/-4.8 percentage points.
Some issue items were asked of half the sample. Those on Form A were asked of 399 and have a margin of error of +/-6.5 percentage points. Form B items were asked of 403 and have a margin of error of +/-6.4 percentage points.Items asked of half-samples on Form A include concern about the issues of public schools, inflation, taxes, and gun violence. Form B asked concern about the coronavirus pandemic, illegal immigration, and ensuring an accurate vote count. Form B also included an item on property taxes and school spending. Concern about crime and about abortion policy were asked on both Form A and Form B.
The partisan makeup of the sample in this poll, including those who lean to a party, is 46% Republican, 44% Democratic and 9% independent. The partisan makeup of the sample, excluding those who lean to a party, is 30% Republican, 28% Democratic and 41% independent.
Since January 2020, the long-term partisan balance, including those who lean to a party, in the Marquette Law Poll has been 45% Republican and 44 % Democratic, with 9% independent. Partisanship excluding those who lean has been 30% Republican and 28% Democratic, with 41% independent.
The entire questionnaire, methodology statement, full results and breakdowns by demographic groups are available at law.marquette.edu/poll/results-and-data.
NOTE: This press release was submitted to Urban Milwaukee and was not written by an Urban Milwaukee writer. While it is believed to be reliable, Urban Milwaukee does not guarantee its accuracy or completeness.
Mentioned in This Press Release
Recent Press Releases by Marquette University

New Marquette Law School Poll finds large majority of Wisconsin voters not yet tuned in to who is running in major 2026 elections
Oct 29th, 2025 by Marquette UniversityNo candidate has established strong position in public favorability in governor, state Supreme Court races; large majorities of voters undecided