
The Red-State Coverage Boom That Congress May End
From Florida to Texas, ACA marketplace enrollment has soared with enhanced tax credits, but failure to extend them could leave millions uninsured starting in 2026.

Hospital waiting area. (Public Domain)
At this point, it appears that the tax credits that make health insurance more affordable will not be extended beyond the end of December. If that happens, millions of Americans are likely to be left uninsured.
The next graph plots the growth in the number of people getting their health insurance through the Affordable Care Act marketplace starting in 2014 and extending through 2025. The data for this chart was calculated using KFF (formerly the Kaiser Family Foundation) estimates of the number of people getting health insurance from the marketplace and dividing this by each state’s population.The chart below plots enrollment by residents of six states, starting with Florida (shown in blue) and followed by five others — Georgia, Texas, Mississippi, South Carolina and Utah. Together, these states have the greatest growth of all states in the ratio of enrollment to population (more on that later).
The bottom two lines (both using dashes) plot ACA marketplace enrollment nationwide and in Wisconsin. Note that each of the lines follows a common trajectory: rapid growth in the first two or three years, followed by stagnant enrollment during the first Trump administration.
Starting around 2020, strong growth returned as the tax credits aimed at preventing an economic collapse in response to the COVID-19 pandemic made health insurance affordable for many who previously were unable to afford it.
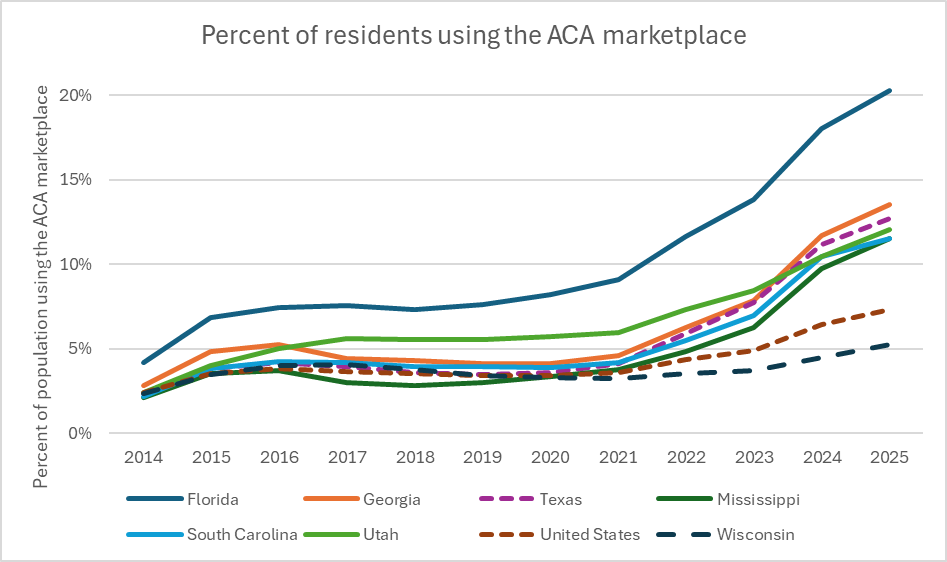
Percent of residents using the ACA marketplace
The scatter plot below summarizes the percentage of each state’s population who got their health insurance through the ACA marketplace, based on the ratio of marketplace enrollment to each state’s population.
The horizontal axis shows the partisan orientation of each state, using results from the 2024 presidential election and the percentage of the vote won by Harris. States won by Trump are shown on the left; those won by Harris, on the right.
The vertical axis shows the ratio of the number of people getting their health insurance through the ACA marketplace to each state’s population. For example, Florida’s ACA marketplace enrolls about 20% of Florida’s population, according to KFF.The ten states that refused to expand their Medicaid programs, despite the promise of additional funding from the federal government, are shown with red dots; the others with blue dots. For most of these states, this left a gap in which a person might have too high an income to qualify for the state’s Medicaid but too little income to qualify for participation in the marketplace.
The large yellow dot represents Wisconsin on the graph. This year, 5.26% of Wisconsinites purchased their health insurance through the ACA Marketplace, according to KFF data. A participation rate of 5.26% puts the state at the low end of the distribution of all Republican states but at the high end for Democratic states. This may be fitting for a state that can go either way in statewide elections.
Wisconsin is one of the ten states to reject the federal government’s offer of a larger contribution to states that expanded Medicaid. However, it set its top income to qualify for Medicaid to the lowest income to qualify for the marketplace, thus eliminating the income gap between the two programs.
Ironically, considering the hostility toward Obamacare among the Republican establishment, the heaviest users of the marketplace are states voting Republican. There are various possible explanations for this phenomenon.
One is the refusal by ten states to expand Medicaid. In nine of these states, this resulted in a gap for people whose income was too high for that state’s Medicaid plan but too low for the marketplace. When Joe Biden’s enhanced tax credits made plans purchased through the marketplace affordable, it gave a feasible option to people in those states who previously had been priced out of the market.
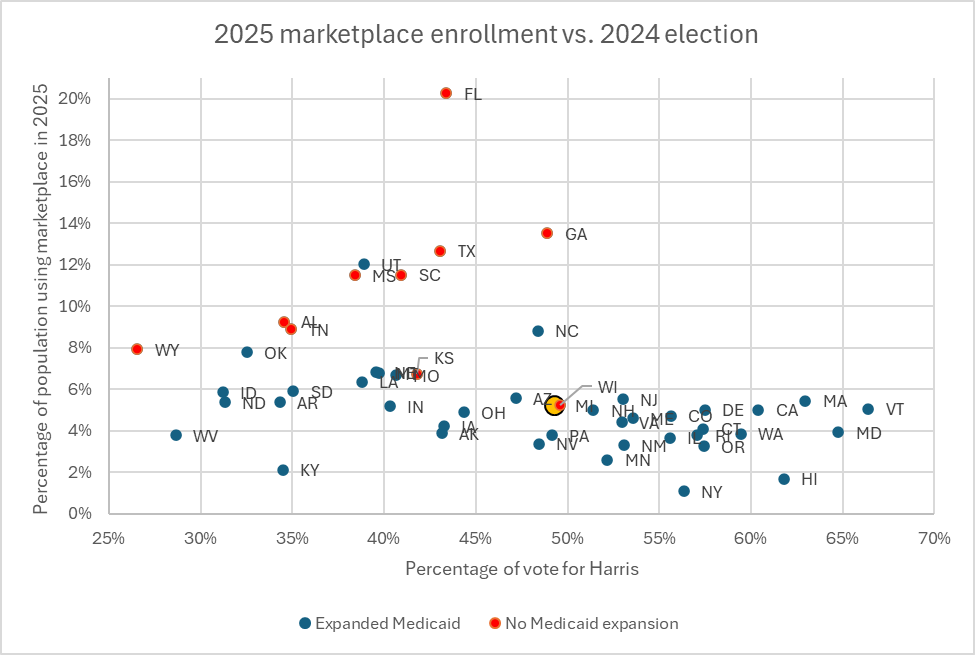
2025 marketplace enrollment vs. 2024 election
With the aid of enhanced tax credits, enrollment in the marketplace more than doubled, from 11.3 million to 24.3 million — an increase of 12.9 million — as shown in the table below. The table also shows the top ten states, ranked according to their increase in enrollment.
Notably, only one state won by Democrats in 2024 — California — is shown in the table. Wisconsin’s marketplace enrollment grew from 195,000 to 314,000, an increase of 118,000.
| State | 2020 | 2025 | Increase | Rank |
| All | 11,393,929 | 24,306,808 | 12,912,874 | |
| Texas | 1,116,293 | 3,966,226 | 2,849,933 | 1 |
| Florida | 1,913,975 | 4,735,415 | 2,821,440 | 2 |
| Georgia | 463,910 | 1,510,852 | 1,046,942 | 3 |
| North Carolina | 505,275 | 975,110 | 469,835 | 4 |
| Tennessee | 200,445 | 642,867 | 442,422 | 5 |
| California | 1,538,819 | 1,979,504 | 440,685 | 6 |
| South Carolina | 214,030 | 631,948 | 417,918 | 7 |
| Ohio | 196,806 | 583,443 | 386,637 | 8 |
| Alabama | 160,429 | 477,838 | 317,409 | 9 |
| Arizona | 153,020 | 423,025 | 270,005 | 10 |
Out of the total marketplace enrollment increase of 12.9 million, 11.4 million, or 88%, went to Republican-voting states, compared with 1.5 million, or 12%, to Democratic-voting states.
The question of extending the enhanced tax credits is an extraordinary one. Under normal conditions, one would expect that representatives of a group that is receiving 88% of the benefits of a policy would be adamantly supportive, while representatives of those receiving 12% might be more skeptical. Yet conservatives in Congress are standing athwart efforts to make health care insurance affordable to their constituents.
Perhaps they are concerned about the cost. The Congressional Budget Office estimates the cost of extending the enhanced tax credits for ten years at $349.8 billion, certainly a large number.
Yet these same Republican members of Congress seem quite comfortable with cutting taxes at a 10-year cost estimated by several nonpartisan organizations at somewhere above $4 trillion — more than 11 times the estimated cost of extending the enhanced tax credits for 10 years.
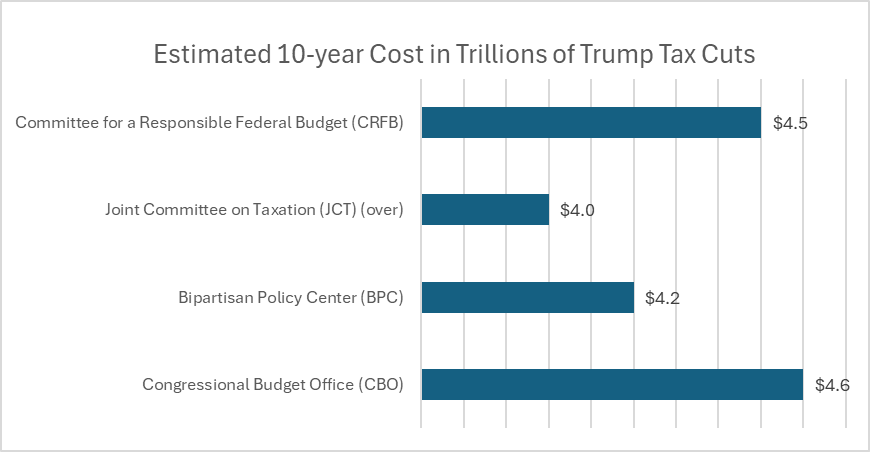
Estimated 10-year Cost in Trillions of Trump Tax Cuts
It is puzzling that Republican members of Congress seem to have decided to ignore the clear preference of 11.4 million of their constituents, who by their actions are sending a clear message.
If you think stories like this are important, become a member of Urban Milwaukee and help support real, independent journalism. Plus you get some cool added benefits.
Data Wonk
-
Who Do You Trust to Conduct Elections Fairly?
 Apr 6th, 2026 by Bruce Thompson
-
Is Non-Citizen Voting a Real Threat to Elections in Wisconsin?
Mar 18th, 2026 by Bruce Thompson
-
How Global Climate Change Affects Milwaukee
 Mar 11th, 2026 by Bruce Thompson


Very informative analysis. Clearly ideology is out performing well-being for constituents in several States. Hopefully they remember at election time.
“The Congressional Budget Office estimates the cost of extending the enhanced tax credits for ten years at $349.8 billion, certainly a large number”.
Funny how when it comes to spending on social programs some politicians think about the cost of the program over a decade and use that as a baseline for why we can’t afford it. But they don’t phrase military spending the same way. We are now spending north of $1,000.00 billion in a single year, or $10,000.00 billion over the next decade for the military. Add a similar expense for interest on the national debt (because of this wasteful spending on military coupled with tax cuts for the wealthy and corporations) and we are talking $20,000.00 billion over the next decade. But no debate on those budget items which cost 57 times the ACA subsidy cost. (Math is so woke, shut up you libtard!)
(In the spirit of bipartisanship the most recent NDAA was passed overwhelming in the Senate, 77-20. Only 16 Democratic Senators could muster the will to vote “no” against the Trump agenda. Good job Tammy and company). LOL).
This seems to underscore the difference between ‘leaders’ who care about the citizens and…the others.