
How Popular Is the Affordable Care Act?
Huge change since 2017, now very popular with voters. A big issue in government shutdown.

Hospital waiting area. (Public Domain)
In the 15 years since the passage of the Affordable Care Act, how have voters’ attitudes towards the ACA changed? The next three graphs show the results of polls taken by KFF (formerly the Kaiser Family Foundation) over this period.
In these polls, voters were asked whether they were favorable, unfavorable, or didn’t know about the ACA. The blue line in the graph plots the percentage of respondents who reported being favorable to the ACA, the orange line the percentage unfavorable, and the green line the percentage reporting that they did not know.
The early years were rough for the ACA, especially with the meltdown of the website when it first went public and the polling reflects that. However, since 2017, more respondents said they were favorable than unfavorable and the favorable majority has grown in subsequent years. Also, the “don’t knows” have almost disappeared in recent polling.
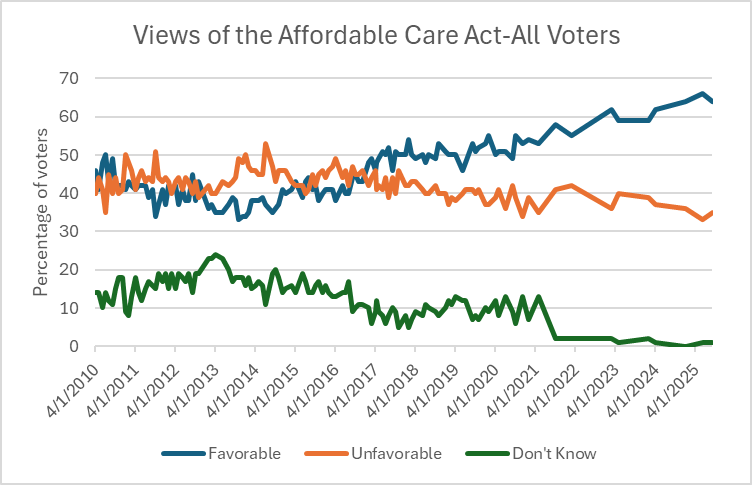
Views of the Affordable Care Act-All Voters
The next graph shows the gaps between each party’s favorable and unfavorable ratings for the ACA. The black dashed line is set at zero, meaning that an equal number of respondents chose favorable and unfavorable ratings.
Not surprisingly, a majority of Democrats have always been favorable to the ACA, but net favorability has grown recently and is now over 90%. Most self-identified Independents have flipped from unfavorable to favorable during this period. Although a majority of Republicans remains unfavorable, that majority has grown smaller in recent years.
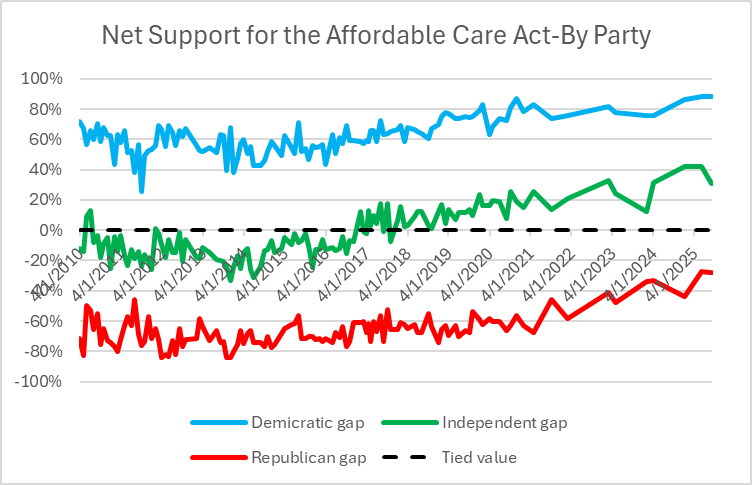
Net Support for Affordable Care Act-By Party
Finally the next graph shows the overall balance of favorable to unfavorable assessments since the ACA was established. There is a dramatic increase in net favorability starting around early 2017.
This corresponds to Donald Trump’s first election. He promised to repeal and replace the ACA with a plan that was “better and cheaper.” It became obvious that he had no idea what should replace the ACA.
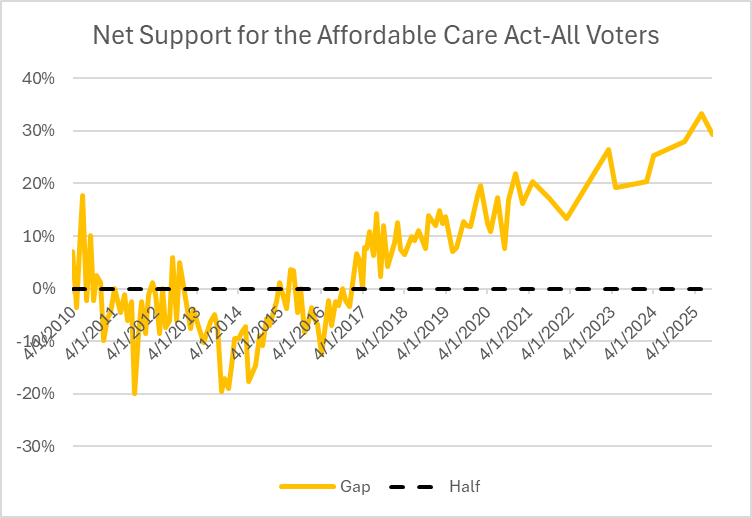
Net Support for Affordable Care Act-All Voters
Although the ACA was a major step in reducing the number of Americans lacking health insurance, it came with significant problems. A major example is the so-called “cliff” faced by older middle-income people. To make insurance sold through the ACA’s marketplace affordable, the act used tax credits to bring down the effective premium to no more than 10% of household income.
The problem arose because the tax credit subsidy ended abruptly if income exceeded 4 times the federal poverty level (400 FPL). For younger people this was no problem because the cost was too low to trigger this limitation. For people close to age 65, however, it made insurance unaffordable.
The red line in the next graph illustrates problem in the case of a 60-year-old Wisconsin adult. Starting on the left-hand side of the chart, the net cost to an individual with $18,000 income would be capped at 2.1% of that person’s income. As income rose, the percentage cap would rise, until being capped at 10% of household income.
However, that subsidy ends when income hits four times the federal poverty level (400% of FPL), about $61,000 per year. Suddenly the cost jumps from 10% to 19.2% of income. This was the situation when COVID-19 hit the world.
In response to concern that the resulting economic shutdown could lead to a recession, Congress passed legislation eliminating the cliff and slightly reducing the other caps. In the graph it is shown by the blue line. Most notably, it got rid of the cliff by capping premiums at 8.5% of revenue.
The problem with these reforms is that they are scheduled to terminate at the end of this year. Unless Congress and the President decide to extend them, the cliff will return in 2026.
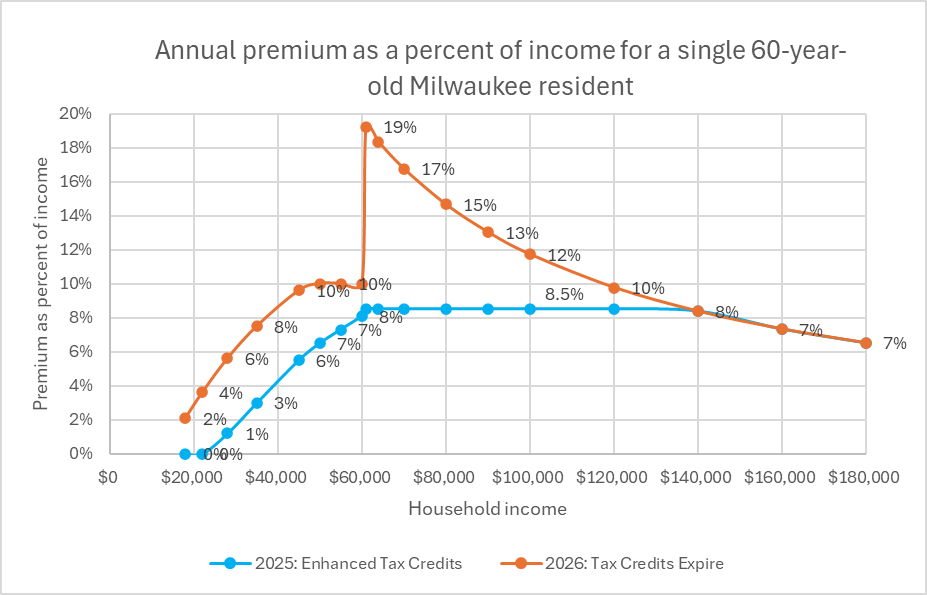
Annual premium as a percent of income for a single 60-year-old Milwaukee resident
The next graph shows the challenge facing a Wisconsin household consisting of two 60-year-old adults and two children. The blue line shows the maximum effective premium this year. Starting at zero, the cap on the effective premium rises with household income, topping out at 8.5% of income.
The red line tracks the relationship between the net premium and income if the tax credits are allowed to expire. As before, the cap rises with income, however rising at a somewhat faster rate and capping out at 10% of income.
At an income of $124,000 this household’s net premium is 10% of income. If instead, income goes to $125,000, the net premium jumps to 24%. Put another way, a $1,000 increase in income triggers a $18,000 increase in the premium.
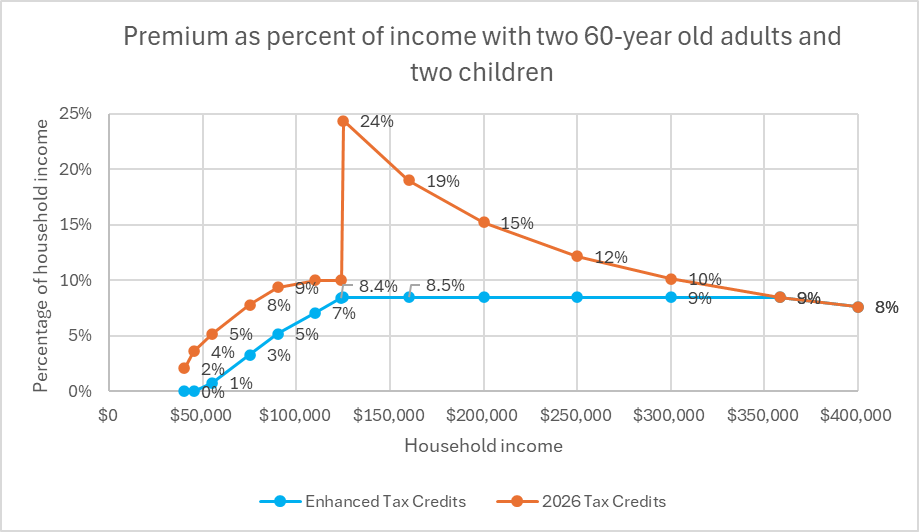
Annual premium as a percent of income with two 60-year-old adults and two children
Since 2010, the number of Americans without health insurance has been cut roughly in half, largely due to the use of tax credits to make insurance purchased on the ACA marketplace affordable. Allowing these credits to expire is likely to reverse that progress and increase the number of Americans without health care insurance.
Who would be most hurt by allowing the credits to go away? The easiest answer is that voters from both parties would find themselves facing unaffordable insurance. However, the available evidence suggests that very high premiums would force more Republicans than Democrats out of the marketplace. Several pieces of evidence lead to this conclusion. One is that all the states with the highest growth in health care policies bought through the ACA marketplace vote Republican.
Another is that many of the jobs involved, such as starting or working for a small business or farming, are done by individuals or small groups of individuals, rather than by employees of large organizations. In addition, some Republican states refused to expand their Medicaid programs, reducing alternatives to insurance bought through the marketplace. Reversing policies contributing to this growth in individual health care policies can be expected to hit those Republican states the hardest.
Wisconsin’s Democratic U.S. Senator Tammy Baldwin has cited the KFF Poll’s finding that 78% of Americans support extending the Affordable Care Act’s enhanced premium tax credits. “Unless Republicans come to the table to negotiate, health care premiums for 270,000 Wisconsinites will double in the new year,” she predicted.
At this point, the argument Republicans are making to Democrats consists essentially of “give us the votes to end the government shutdown and we will be willing to talk about extending the tax credits.” This is a meaningless offer: Democrats are being asked to give up their leverage for nothing.
If you think stories like this are important, become a member of Urban Milwaukee and help support real, independent journalism. Plus you get some cool added benefits.
Data Wonk
-
Who Do You Trust to Conduct Elections Fairly?
 Apr 6th, 2026 by Bruce Thompson
-
Is Non-Citizen Voting a Real Threat to Elections in Wisconsin?
Mar 18th, 2026 by Bruce Thompson
-
How Global Climate Change Affects Milwaukee
 Mar 11th, 2026 by Bruce Thompson


The remaining thirty-some percent of voters that hold unfavorable views are trump loyalists who believe everything he says. Despite the ACA’s success and significant help for many Americans, it does not address the root cause of the problem. The USA has the most expensive health care in the world by far, with the same or worse outcomes as most nations. The ACA simply applies a band-aid of financial support to help pay for the massive inefficiencies in our horrible healthcare system. Unfortunately, with our largely dysfunctional government, true healthcare reform is decades or even generations away. We’d need citizens united overturned (or banned by constitutional amendment) and ranked choice voting implemented at all levels for 10-20 years before we got there.
I still don’t understand why the Democrats aren’t voting for a continuing resolution to fund the government.
There is a need to work out the healthcare issue. But does working out an issue mean you have to close the government?
There is also the problem of money. There are only so many tax dollars, and we’re in debt.
Perhaps there should be some reduction in government spending? Interest paid on the national debt – how is that helping anyone?
ACA wasn’t intended to reduce the cost of healthCARE; is was intended to reduce the cost of health INSURANCE and to increase its availability. Before ACA some insurance companies even denied coverage if you had acne.