
How Wisconsin’s Taxes Turned More Regressive
It was supposed to make Wisconsin's economy better. Did it?

Form 1040. Photo by ‘PT Money’ (ptmoney.com). (CC BY 2.0) https://creativecommons.org/licenses/by/2.0/
In his famous “Cross of gold” speech at the Democratic National Convention in Chicago on July 9, 1896, William Jennings Bryan identified “two ideas of government”:
There are those who believe that if you just legislate to make the well-to-do prosperous, that their prosperity will leak through on those below. The Democratic idea has been that if you legislate to make the masses prosperous their prosperity will find its way up and through every class that rests upon it.
In the century and a quarter since Bryan addressed the convention, the battle between those two ideas has driven many of the nation’s political controversies. The central question is how governments raise the funds they need to operate: what the relationship should be between the amount a taxpayer pays in taxes and that taxpayer’s income.
Taxes are considered “regressive” if higher income taxpayers pay a lower percentage of their income than do those with lower incomes. Taxes that rise faster than income are considered “progressive.” If a tax increases at the same rate as income, it is “proportional” (or sometimes “flat”).
Of the three major forms of taxes, income taxes are generally progressive, with higher tax brackets that kick in as income goes up. Sales taxes and property taxes are regressive, costing a much higher percentage of incomes of the poorest payers.
In practice, tax systems are a mix of progressive and regressive taxes. Whether the overall system is progressive or regressive depends on the weights given to each.
The graph below shows the percentage of their income that residents of Wisconsin and of Minnesota pay, on average, in state and local taxes. Wisconsin taxes are shown in blue and Minnesota’s in green. This graph is based on calculations by the Institute on Taxation and Economic Policy (ITEP).
To derive this graph, ITEP divided the states’ population into five equal sized groups based on income and calculated the average percentage of each group’s income that went for taxes. The group with the top 20% of income was further divided into three groups: the next 15%, the next 4%, and the top 1%.
As the chart shows, as income goes up in Wisconsin the current tax rate goes down. The bottom fifth pay an average rate of 10.8% of income to the state, compared to 6.7% for the top 1%. When all taxes are considered, Wisconsin’s tax system is regressive. ITEP places it as 27th most regressive among the 50 states.
The story is quite different for Minnesota. As the graph shows, the lowest 20% of earners paid, on average, 6.2% of income in taxes. This compares to the top 1% of earners who paid 10.5% of income in taxes.
According to ITEP’s calculations, Minnesota’s tax system was the most progressive of all the 50 states. Note, however, that Minnesota’s progressivity occurs in the lower 40% of Minnesotans. Above that, Minnesota is effectively a proportional tax state with the overall rate right around 10%.
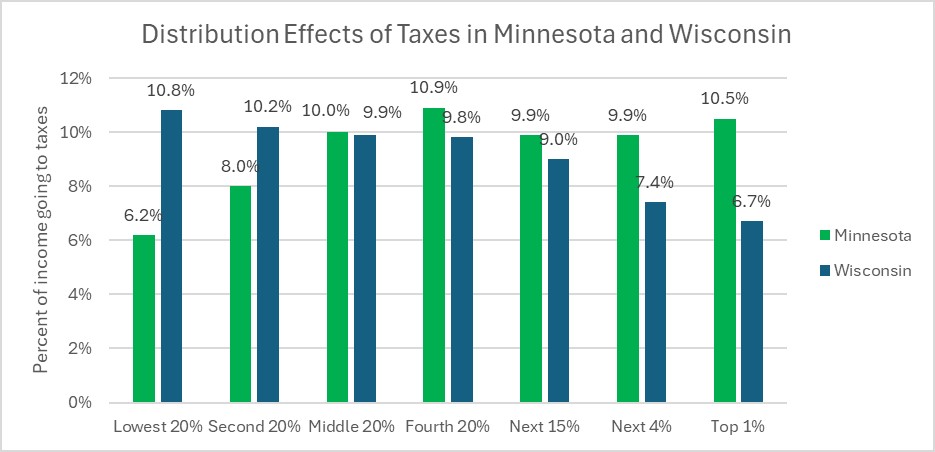
Distribution effects of taxes in Minnesota and Wisconsin.
Until several years ago, Wisconsin’s tax system was far less regressive than it is today. ITEP ranked it 37th most regressive among the states.
Then Governor Scott Walker, a devotee of Bryan’s first idea of government, convinced the state Legislature to make Wisconsin far more regressive than before by reducing taxes on wealthier people. A headline in the January 24, 2014, Milwaukee Journal Sentinel tells the story: “Top wage earners get biggest benefit from Gov. Scott Walker’s tax cuts.” The article went on to explain:
“The top 20% of Wisconsin wage earners — those making more than $88,000 a year and paying the most in taxes now — would receive 44% of the benefit of Gov. Scott Walker’s latest proposed tax cuts, a new analysis shows.
“The bottom 20% of state residents by income — those making below $21,000 a year and paying the least in taxes now — would receive 5% of the $504.6 million Walker wants to cut in property and income taxes, according to the review by the liberal Institute for Taxation and Economic Policy and the Wisconsin Budget Project.”
Walker promised this would “make the economy better” in Wisconsin.
Did his switch to a more regressive mix of taxes accomplish this? The next graph compares the real gross domestic product in Wisconsin and Minnesota since 2005. If anything, it suggests that regressive taxes may come at an economic cost, as Wisconsin has fallen further behind in GDP since 2014.
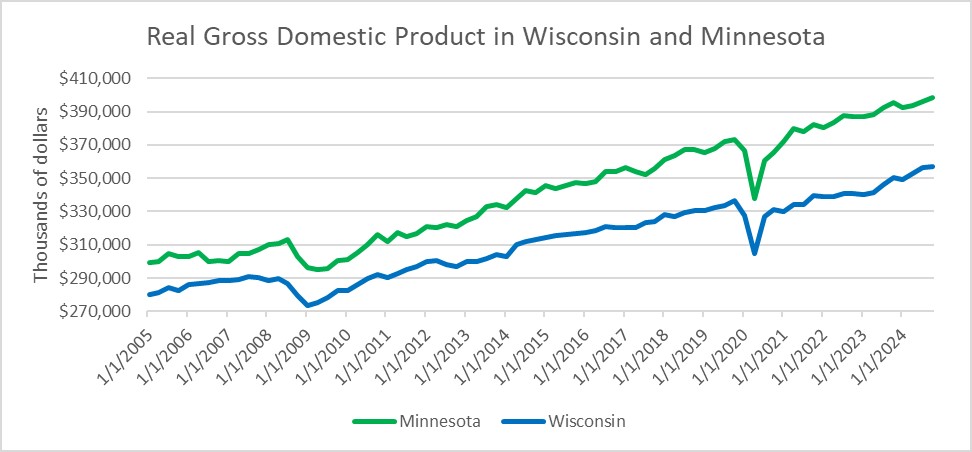
Real gross domestic product in Wisconsin and Minnesota.
The next graph shows the number of jobs in the two states. A similar if stronger story is told. At the start of this period, Wisconsin had about 100,000 more jobs than Minnesota, but lost that edge by the time Walker left office. As with the GDP, it is important to not over-interpret the data. At the very least, however, one can say that the data does not support the thesis that the secret to prosperity is reducing taxes on wealthy people.
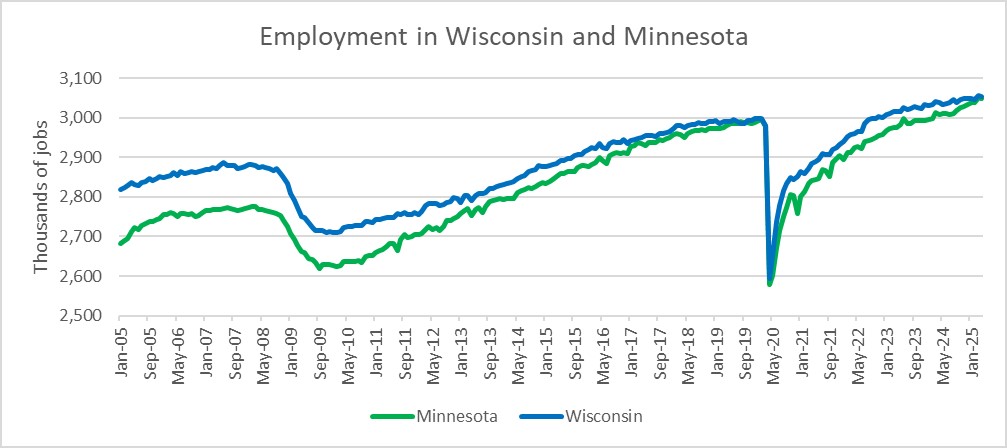
Employment in Wisconsin and Minnesota
Despite all the lack of evidence for the economic effectiveness of regressive taxes, the claim that the key to prosperity lies in reducing taxes on wealthy people continues its hold, particularly in the Republican Party’s political decision making.
If you think stories like this are important, become a member of Urban Milwaukee and help support real, independent journalism. Plus you get some cool added benefits.


You would think 130 years after Bryan’s Cross of Gold speech one would think the message would sink in that regressive taxes don’t result in prosperity. Wisconsin has proved that.
Here we are in the 21st century and too many people — including those who do not benefit from the myth — still believe in it.