The Use and Abuse of Jobs Data
Walker administration used flimsy interpretations of jobs reports to put a positive spin on the state's economy.
Scott Walker speaking at the 833 East groundbreaking event in downtown Milwaukee in 2014. Photo by Jeramey Jannene.
Since the day he became governor, Scott Walker had his staff scan the monthly Bureau of Labor Statistics employment reports to identify elements that would support the theme of Wisconsin economic success. For example, if Illinois added more jobs than Wisconsin, report that the percentage increase in Wisconsin was greater than the percent in Illinois. Conversely, if Iowa’s percentage increase exceeded Wisconsin’s, report that Wisconsin added more jobs than Iowa.
The first page or two of each monthly report from Wisconsin’s Department of Workfare Development was devoted to spinning the data. An early example came when Walker had been governor for six months.
On July 21, 2011 a Journal Sentinel article reported that: “Bucking a lackluster hiring trend nationally, Wisconsin added an estimated 12,900 private-sector jobs from May to June – the largest single-month gain since September 2003.” It went on to quote Walker:
“It’s incredibly important to put that in perspective,” Walker said. “To have 9,500 net new jobs in the state at a time when the country saw just 18,000 net new jobs all across the country is incredibly good news, and it’s driven by the rebirth of tourism in the state.”
This news generated a flurry of press releases from Republican groups–including the MacIver Institute and the Wisconsin GOP—and Republican politicians—including state representatives Michelle Litjens, Scott Suder, and Joan Ballweg–celebrating this accomplishment. The numbers conclusively proved that Walker’s policies were working, in their view.
As U.S. Rep. Jim Sensenbrenner said: “The labor (department) report that came out last week had 18,000 jobs created in the country. But half of them were in Wisconsin, so we must be doing something right.”
The claim that Wisconsin accounted for half the job growth was challenged in a July 23 Cap Times article entitled “Biz Beat: GOP job counters need a math lesson.” pointing out that several states, including Texas, California, Michigan, and Minnesota had larger job growth than Wisconsin. A few days later, the Journal Sentinel followed up with a Wisconsin PolitiFact analysis rating False the claim from the state GOP, that “over 50 percent of U.S. job growth in June came from our state.”The estimates of 9,500 new non-farm jobs and 12,900 private sector jobs were published in July of 2011. Since then, there were several revisions as additional data, became available, such as that on the quarterly unemployment insurance reports. When all the revisions were made, the best estimate is that Wisconsin lost 2,000 non-farm jobs between May and June of 2011. As to the 12,900 supposed increase in private sector jobs, the state gained 900. (2,900 jobs in government are estimated to have been lost, compared to 3,400 in the original estimate.)
Month to month jobs figures are extremely volatile. As the next graph shows, for both total and private sector employment they jump considerably from one month to the next.
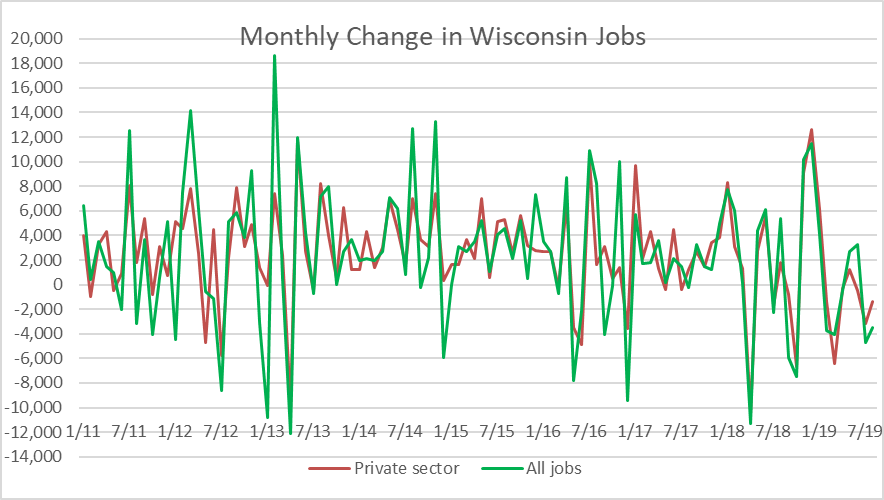
Monthly Change in Wisconsin Jobs
Both Governor Walker and other state officials criticized the federal BLS for providing inaccurate jobs data. Then-DWD secretary Reggie Newson added a table to the monthly reports comparing the original and revised estimate. He complained that:
These unreliable statistics out of Washington misinform the public and create unnecessary anxiety for job seekers and job creators about our state’s economy.
Yet, despite their recognition that any single month’s estimate was unreliable when taken in isolation, Walker and company continued to use cherry picked data from every month’s report. Here is the opening paragraph on the DWD’s October 2018 press release, the last generated before Walker’s final November election:
The United States Department of Labor’s Bureau of Labor Statistics (BLS) today released state-by-state employment and unemployment rankings that show Wisconsin added statistically significant 22,800 manufacturing jobs between September 2017 and September 2018, second highest in the nation. Wisconsin trailed only Texas in the number of manufacturing jobs added.
The release went on to quote the current secretary as saying, “We have been adding manufacturing jobs at a higher rate than all Midwest states …” Yet, as the next graph shows, Michigan, Indiana, and Ohio all had higher manufacturing job growth between September of 2017 and September 2018. Rather than 22,800 jobs as claimed by DWD, the current estimate is that Wisconsin added 10,100 manufacturing jobs.
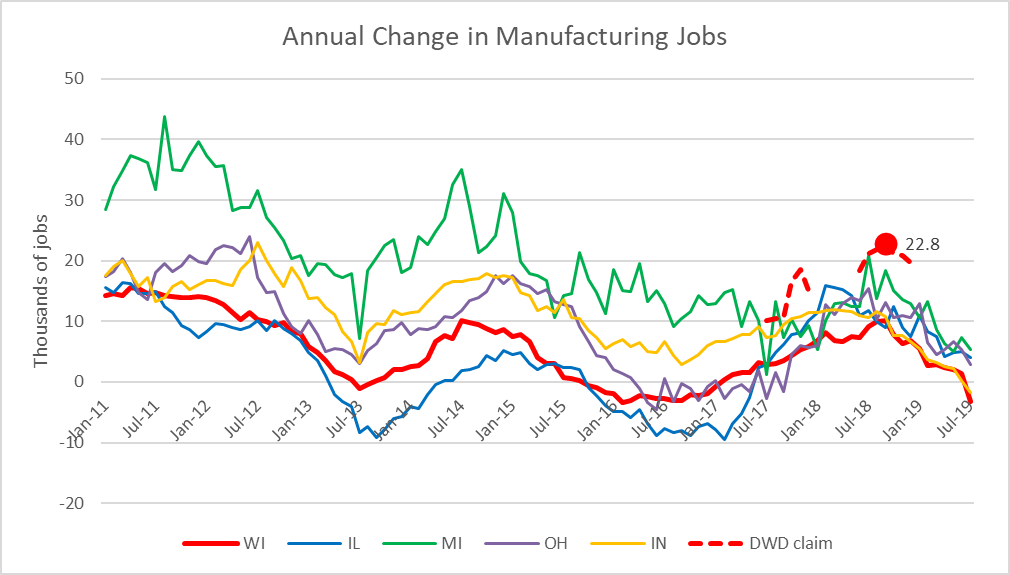
Annual Change in Manufacturing Jobs
What explains the discrepancy? Again, it reflects the recalculation based on additional information. The BLS includes a note with the January 2019 report that the estimates were adjusted to reflect counts from the BLS Quarterly Census of Employment and Wages. It turns out the Wisconsin manufacturing jobs were overestimated in 2018.
A similar overestimate occurred with 2017 months but was corrected at the beginning of 2018. Thus, the gain of jobs was calculated initially by comparing inflated 2018 figures with adjusted 2017 numbers. Likewise, the apparent gain in 2017 would have been inflated. On the graph, I show the gain before the adjustment with a red dashed line.
The irony is that Walker and his DWD secretaries recognized the squishiness of monthly jobs numbers. Yet they were very willing to use that squishiness when it served their purpose—to make claims based on a single month that their policies were effective.
Perhaps the most notable pattern in the previous graph is that the states track each other. When manufacturing jobs are growing in Wisconsin, they are likely to grow in the other midwestern states. Likewise, when hiring is down. This implies that state policy has a minor role to play.
Last year public radio station WUWM did a story about a Data Wonk article which used a regression model to estimate the effect of Walker’s policies on Wisconsin jobs. The station asked Walker’s administration for a response. Here it is:
More people are working in Wisconsin in 2018 than ever before under Governor Walker’s leadership, wages are up, and we’ve had seven consecutive months of unemployment at or below 3 percent. If you take a look at a whole host of measures, this is the best economy Wisconsin has seen in 18 to 20 years.
The trouble with this argument is that the eight years of Walker’s administration were a time of expansion nationally. One would expect that more people would be working at the end of the period, regardless of state policies.
Note: Here are links to a list of monthly Wisconsin DWD press releases and to the monthly BLS list of state jobs data.
Data Wonk
-
Who Do You Trust to Conduct Elections Fairly?
 Apr 6th, 2026 by Bruce Thompson
-
Is Non-Citizen Voting a Real Threat to Elections in Wisconsin?
Mar 18th, 2026 by Bruce Thompson
-
How Global Climate Change Affects Milwaukee
 Mar 11th, 2026 by Bruce Thompson