

How Successful Has The Trump Economy Been in Creating Jobs?
Graphs of jobs, labor force and manufacturing tell a different story than the campaign speeches do.
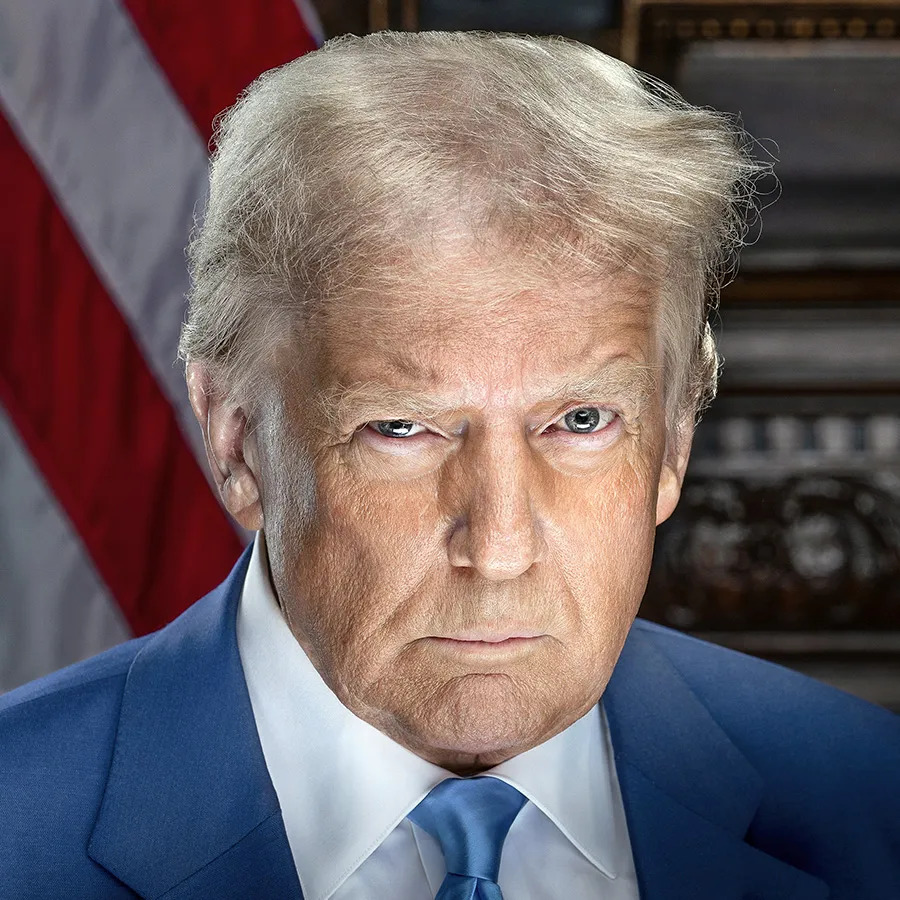
Donald Trump. Photo from the White House.
“When I win the election, we will immediately begin a brand-new Trump economic boom,” Donald Trump said at an August 2024 rally in North Carolina during his campaign for reelection. How successful has the Trump economy been?
The next graph shows Wisconsin nonfarm job growth during the terms of the five most recent presidents. Percentage growth has been annualized to remove the effect of term-length differences. Red columns represent Republican presidents; blue columns represent Democrats.
The graph suggests that the increase in jobs was weak when Trump was president. In his first term, the number of jobs shrank, most likely because of the COVID-19 pandemic. In his current term so far, nonfarm job growth in Wisconsin has been very weak.
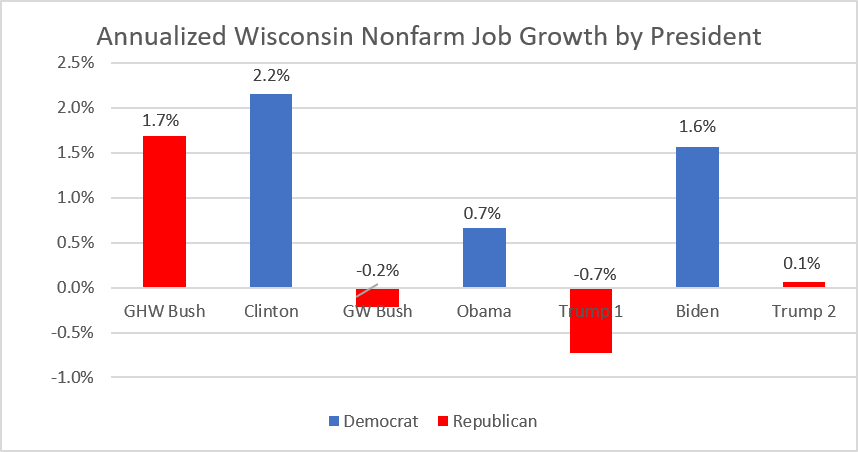
Annualized Wisconsin Nonfarm Job Growth by President
The next graph shows U.S. job growth for the whole nation since the Truman administration. Again, job growth was weak during both Trump terms. And again, job growth was quite strong during Biden’s term in office.
There is a striking pattern in this and other graphs. As a group, blue columns are taller than red columns. This pattern is not new. It was first identified at least 20 years ago. While correlation does not prove causality, I would suggest a number of possible reasons behind the phenomenon:
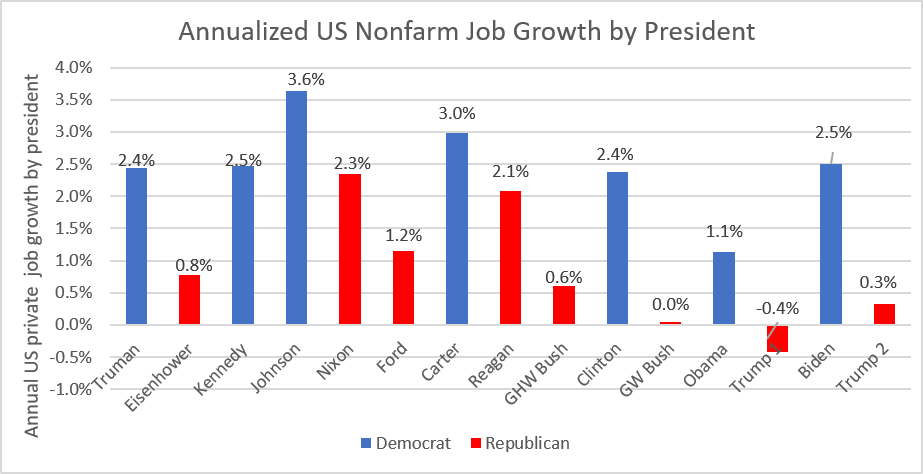
Annualized US Nonfarm Job Growth by President
The next graph shows the month-to-month change in employment during the Biden and Trump administrations. This suggests another possible explanation: Early in the Biden administration, the economy came back to life as masks and vaccines became widely available. By the time Trump became president, in this view, the demand for workers was largely satisfied.
The August jobs report caused a good amount of excitement among Trump and his allies. As shown on the graph, the Bureau of Labor Statistics estimated that 162,000 nonfarm jobs were added to the U.S. labor market, following a revised July estimate of only 21,000 jobs.
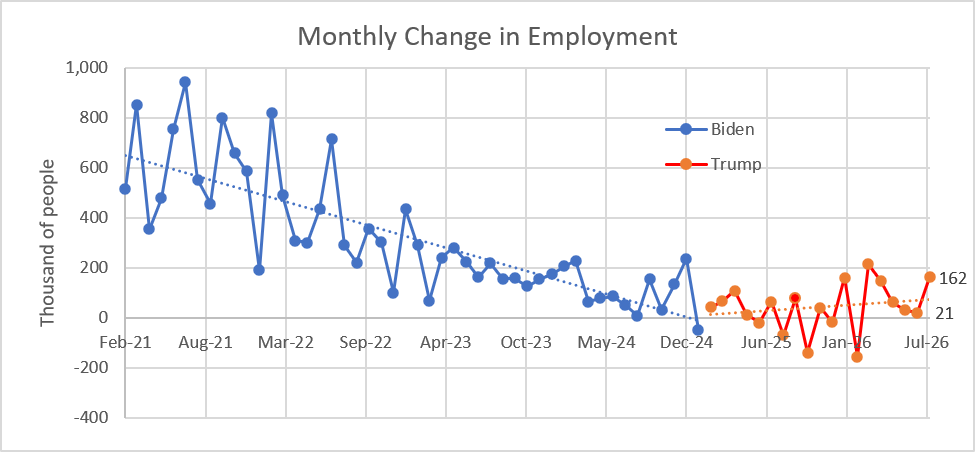
Monthly Change in Employment
Data on the labor force tell much the same story, both in Wisconsin and in the nation. The next graph shows the annualized change in Wisconsin’s civilian labor force.
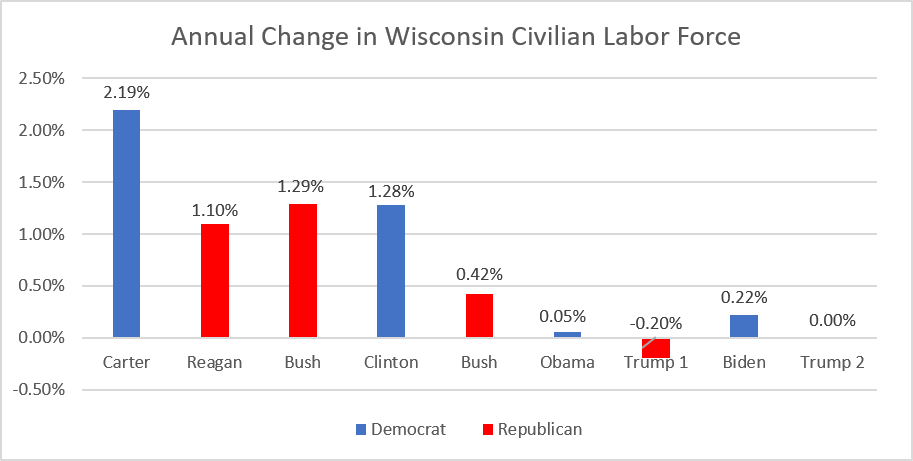
Annual Change in Wisconsin Civilian Labor Force
The next graph shows the annualized change in the civilian labor force in the United States.
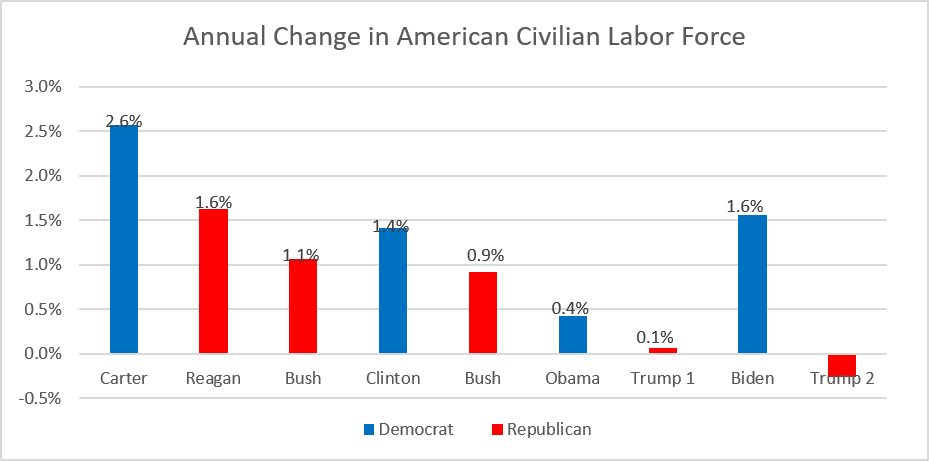
Annual Change in American Civilian Labor Force
During his reelection campaign, Trump promised to bring back manufacturing: “Together, we’re going to … bring thousands of factories back to the USA, right where they belong — and that will be done through tariffs and smart policy. We will build American, we will buy American, and we will hire American” (Jan. 19, 2024).
The next graph shows the percentage change in Wisconsin manufacturing jobs since the first Bush presidency. The last time Wisconsin saw strong growth in manufacturing came during the Clinton administration. Contrary to his promise, manufacturing has declined under both Trump terms.
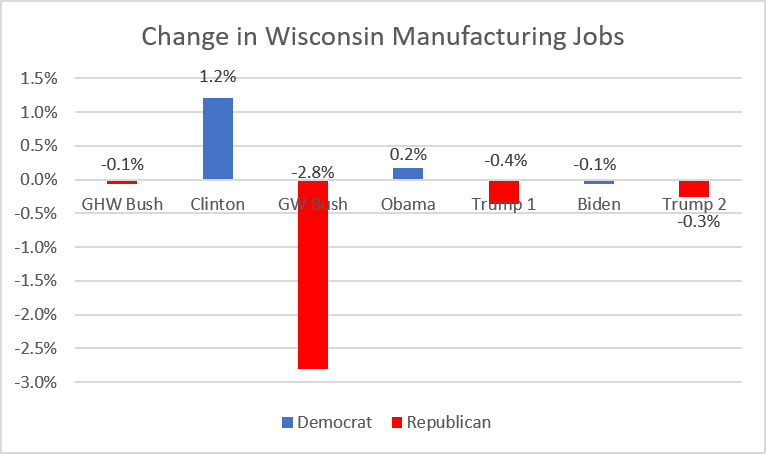
Change in Wisconsin Manufacturing Jobs
The next graph shows the change in US manufacturing since the Truman administration. The overall trend line is downward. The closest to a turnaround came during the Biden administration.
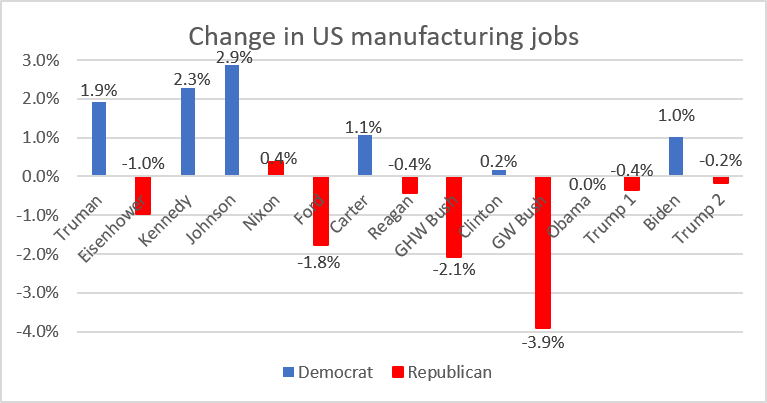
Change in US Manufacturing Jobs
Time and again we see a yawning gap between what Trump claims and the facts.
If you think stories like this are important, become a member of Urban Milwaukee and help support real, independent journalism. Plus you get some cool added benefits.


Data Wonk
-
The Arguments Against Wisconsin’s Congressional Maps
 Sep 9th, 2026 by Bruce Thompson
-
How Gerrymandered Are Wisconsin’s Congressional Districts?
Sep 2nd, 2026 by Bruce Thompson
-
Learning Our Lesson From COVID-19
 Aug 19th, 2026 by Bruce Thompson



















When trump’s lips are moving he is lying so………